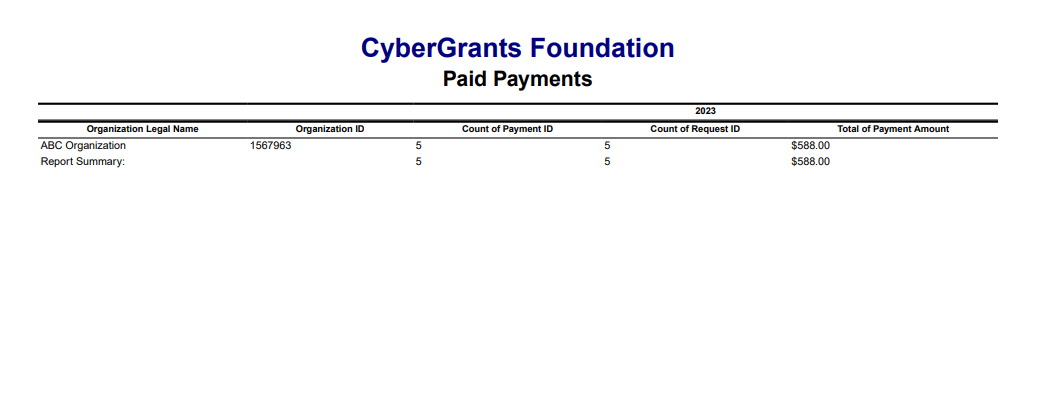
Matrix reports provide a summarized view of your data, making it easier to analyze totals, averages, and counts across categories. Instead of displaying individual details, a Matrix report highlights aggregated insights such as sums, percentages, or averages. By defining rows, columns, and calculated cells, you can transform detailed data into meaningful summaries tailored to your business needs. Customers can generate these reports in several formats, including ASCII, CSV, Microsoft Excel, HTML, and PDF (landscape or portrait).
The following steps will guide you through the process of creating and running a Matrix report, from setup through execution.
Step 1: Access the Reports tab
In Bonterra CyberGrants, go to the Reports tab.
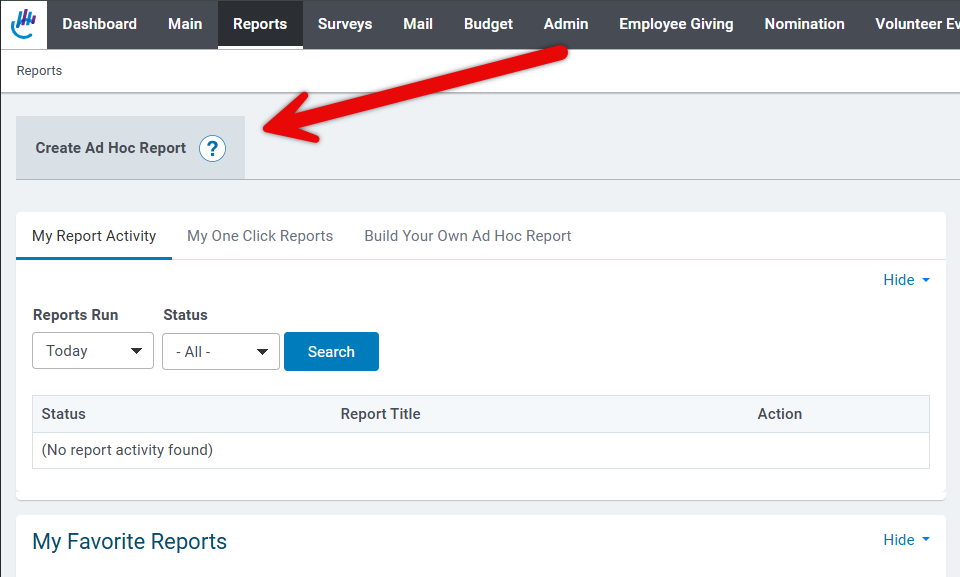
Step 2: Create an Ad Hoc Report
Click Create Ad Hoc Report to begin building your custom report.
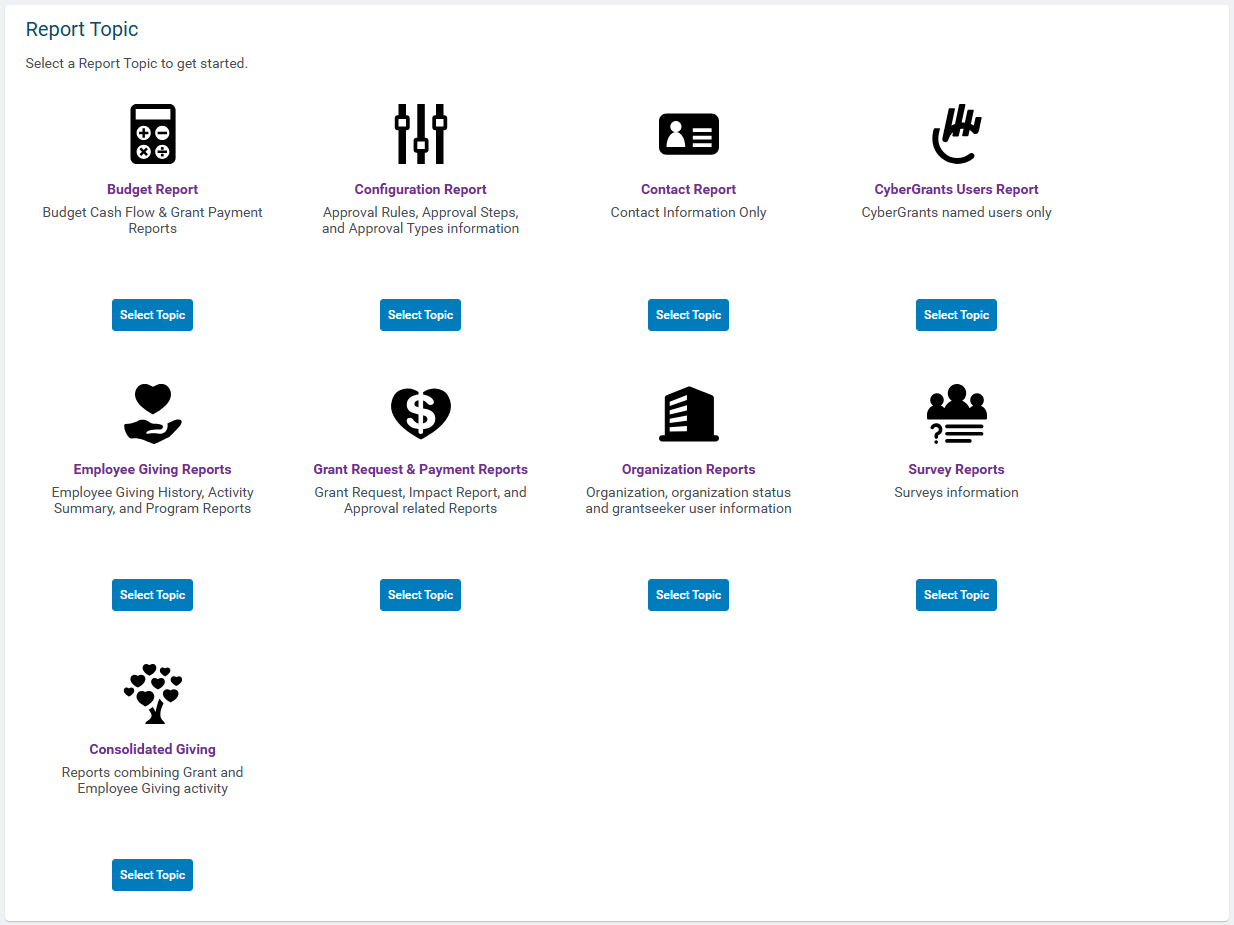
Step 3: Select a Report Topic Category and Topic
Choose the appropriate Report Topic Category that best matches the type of data you want to analyze. Then, select the Report Topic within that category.
Step 4: Apply Filters
Define the filters and field values for your report.
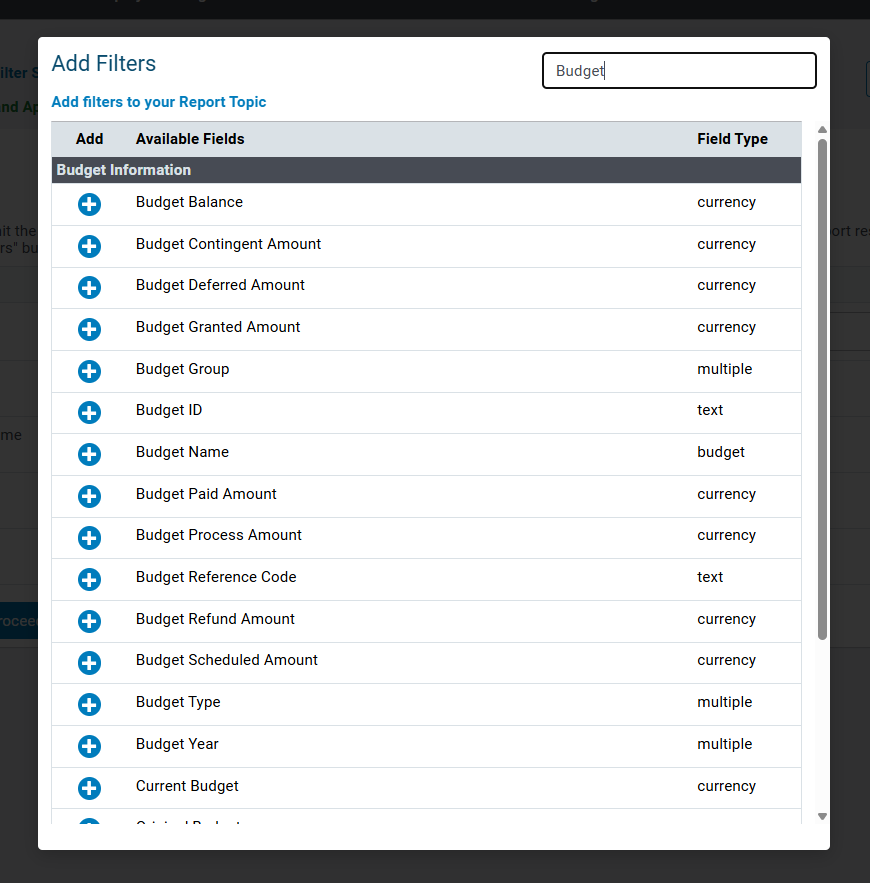
When complete, click Save and Proceed.
Step 5: Choose Report Type
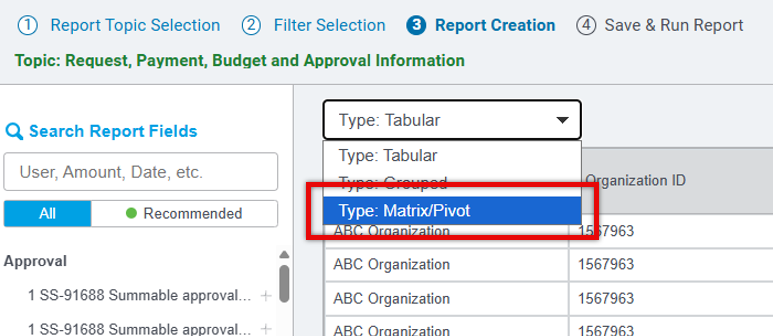
Select Matrix/Pivot as the report type.
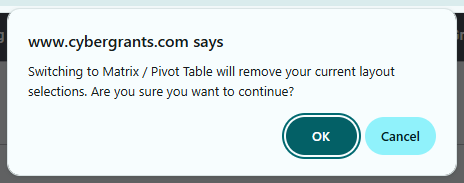
Important: When switching to a Matrix report, all fields and layouts from the existing report topic will be cleared. A pop-up reminder will display. Click OK to confirm or Cancel to return without making changes.
Step 6: Define matrix structure
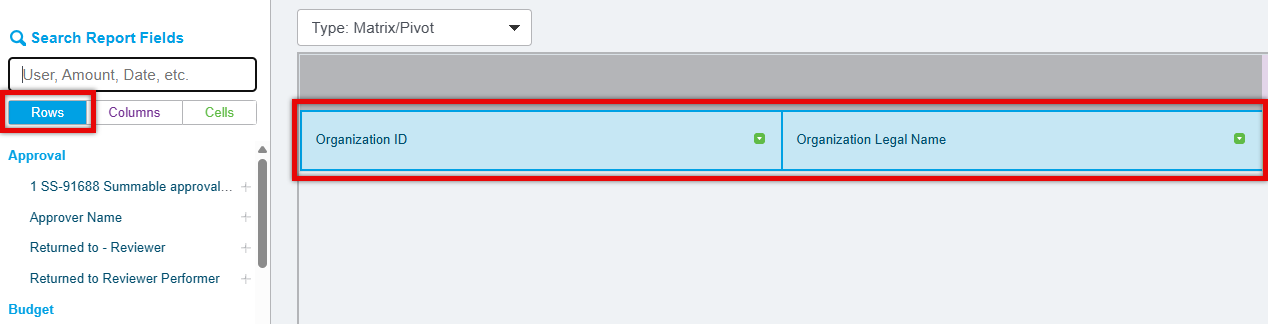
A blank form displays when you switch to the Matrix report type. From here, configure the rows, columns, and cells:
- Matrix Rows - Select the fields to display as rows in the report.
- Matrix Columns - Select one field to display as the column in the report.
- Matrix Inner Cells - Add calculated fields for your analysis. Only numeric or currency fields are eligible.
Available calculated fields include: average, count, median, minimum, maximum, sum, percent of total, and unique count.
Step 7: Search and manage fields
Use the search function to locate and add fields to rows, columns, or cells:
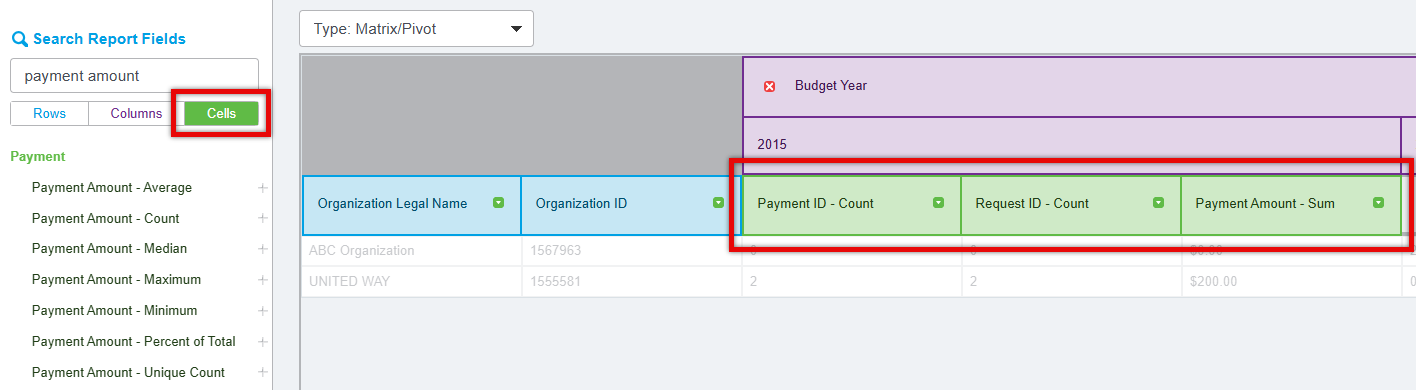
- Select Rows, Columns, or Cells before searching.
- Enter a keyword, then click the plus (+) icon or drag and drop the field into the section.
Visual indicators highlight each section:
Rows = blue
Columns = purple (limited to one column)
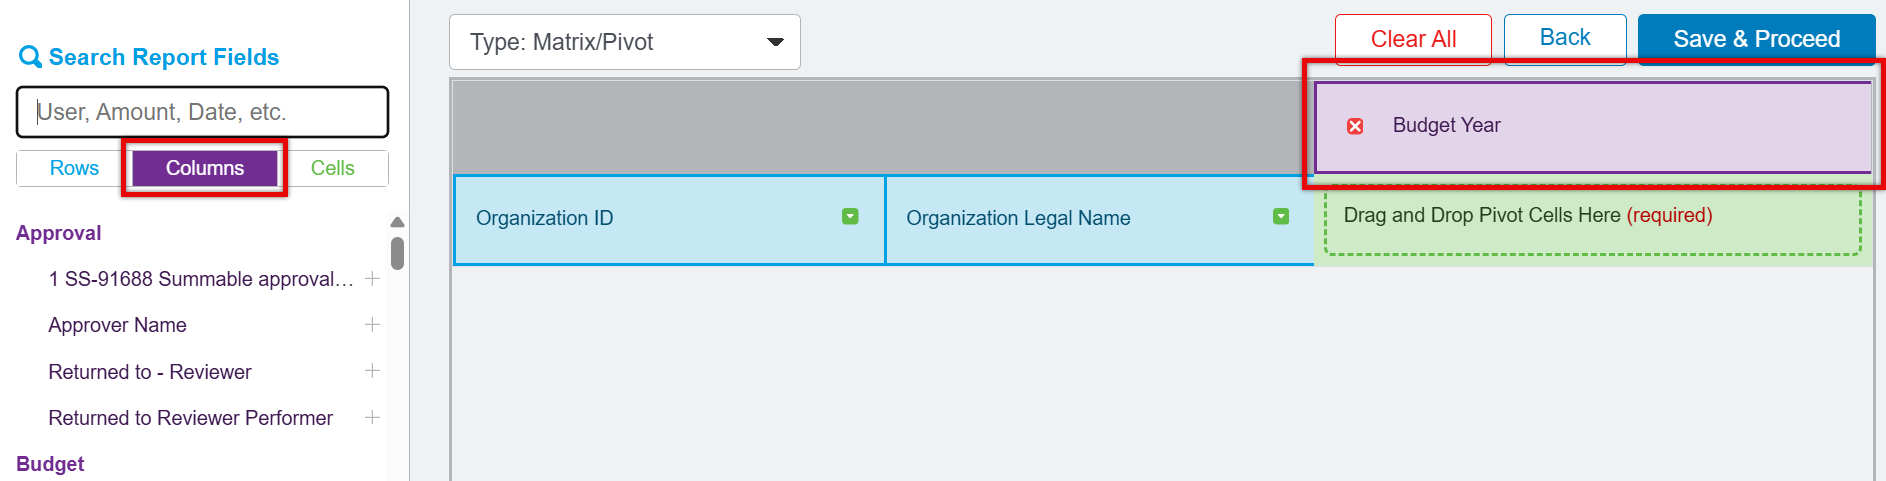
Cells = green
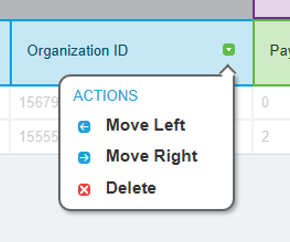
You can move fields using directional arrows or delete them using the red X icon.
To clear all fields, click Clear All. To return to the previous filter page, click the Back button.
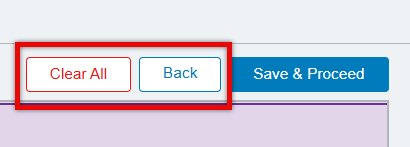
When finished, click Save and Proceed.
Important: Pivot cell fields are limited to calculated values, such as sums or counts.
Step 8: Save and run the report
Click Save & Run Report. The system will queue the report for processing. Once complete, select Open to view the results.