Insights offers a set of standard dashboards to streamline the visualization and analysis of your program's CRA-eligible activity. These dashboards provide an aggregate-level view of your community impact, allowing you to track progress toward your goals and simplify the process of gathering and validating your CRA efforts.
Proceed as follows to access and explore the Insights Community Impact Standard Dashboards.
Step 1: Access Insights Standard Dashboards
Navigate to the Insights platform and select the applicable Community Impact Standard Dashboard.
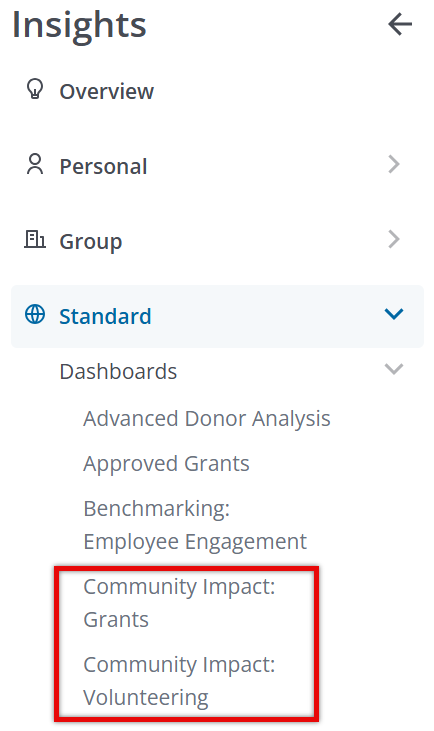
Step 2: View the Community Impact: Grants Dashboard
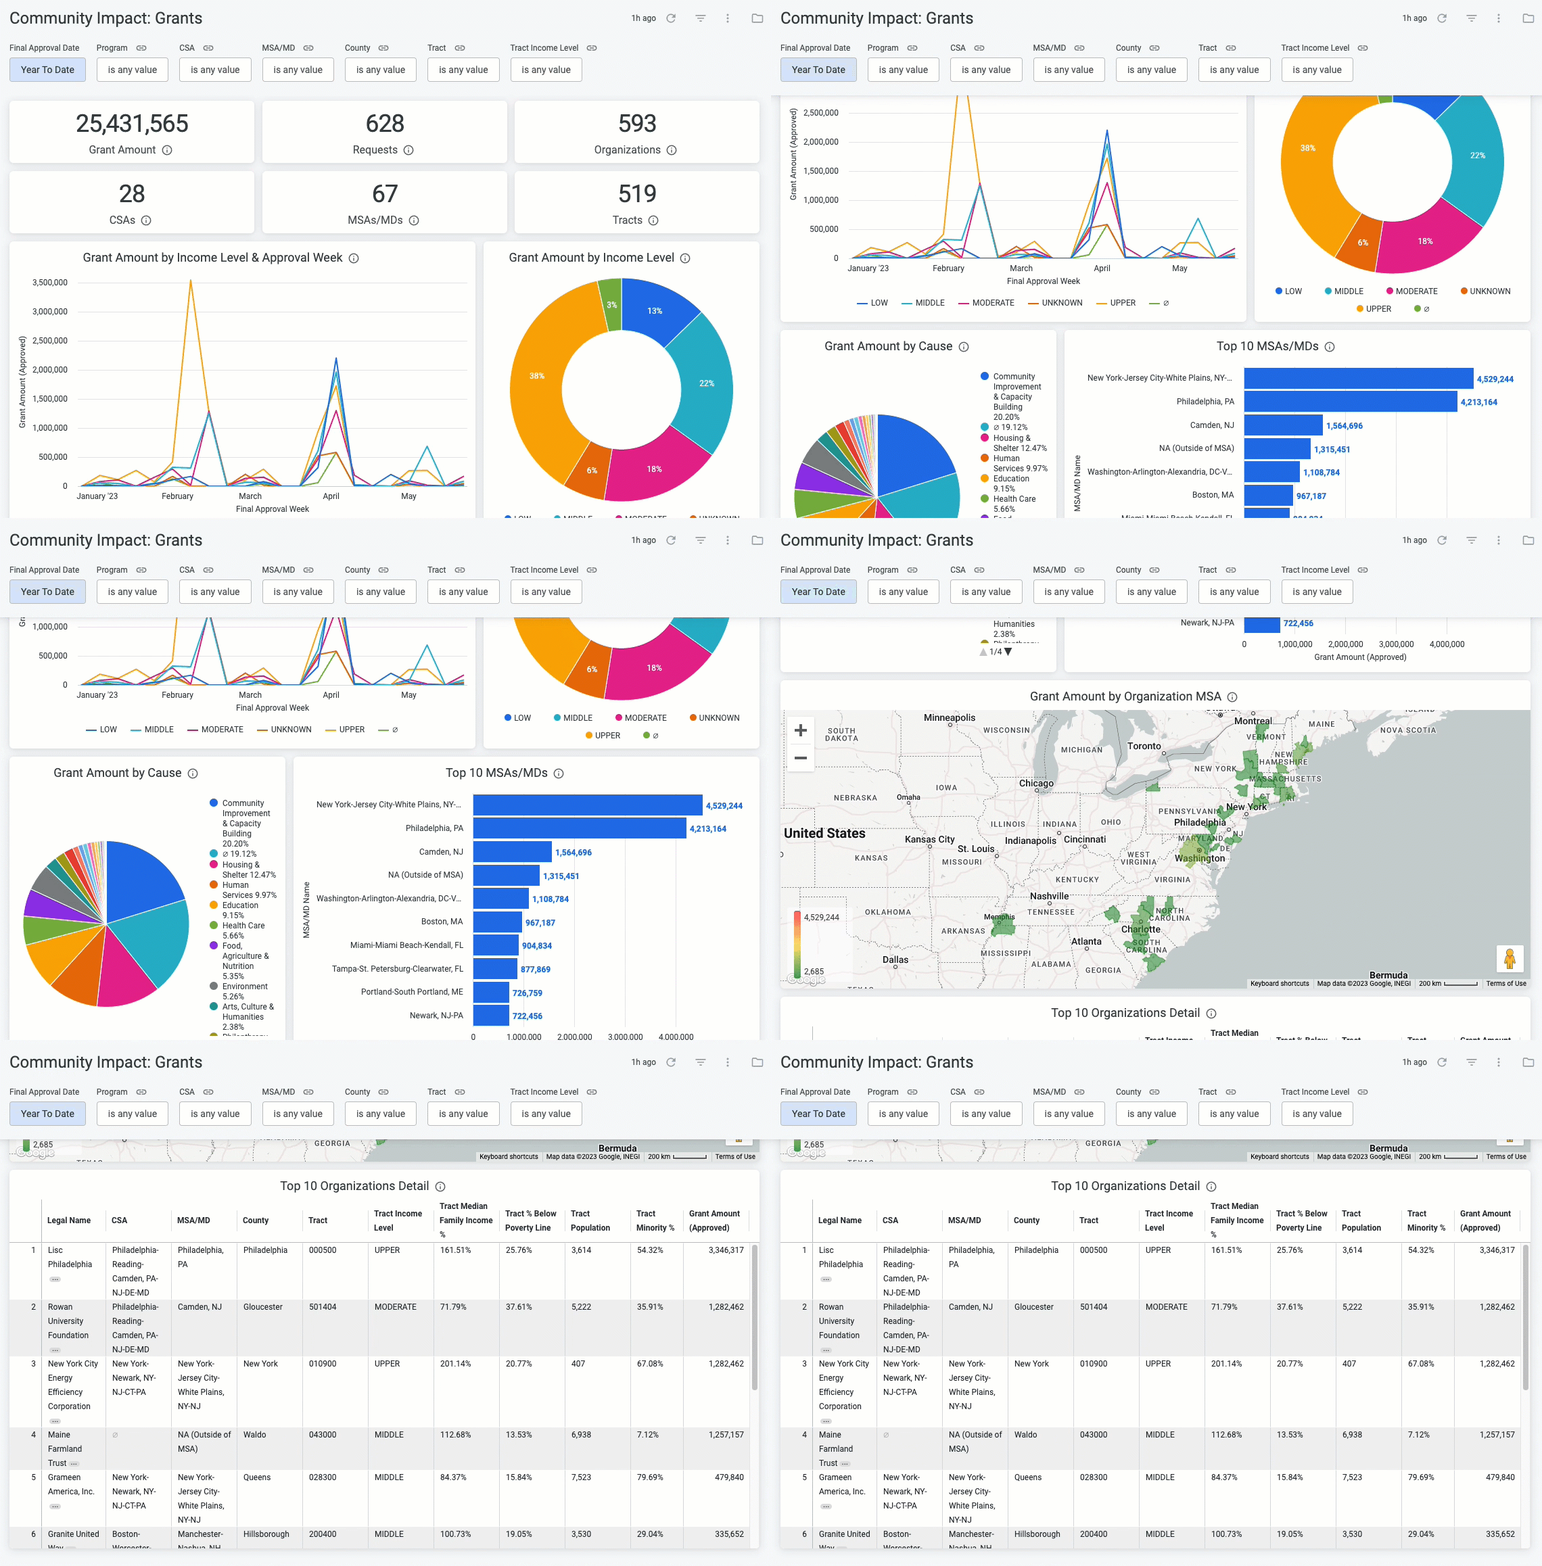
The Community Impact: Grants Dashboard includes the following filters and visualizations:
Filters:
- Final Approval Date
- Program
- CSA
- MSA
- County
- Tract
- Tract Income Level
Visualizations:
- Total Approved Grant Amount
- Approved Request Count
- Unique Organization Count
- Unique CSA Count
- Unique MSA Count
- Unique Tract Count
- Grant Amount by Tract Income Level & Approval Week
- Grant Amount % by Tract Income Level
- Grant Amount % by Organization Cause
- Top 10 MSAs by Approved Grant Amount
- Grant Amount by Organization MSA (heatmap)
- Top 10 Organizations Detail by Approved Grant Amount
Step 3: View the Community Impact: Volunteering Dashboard
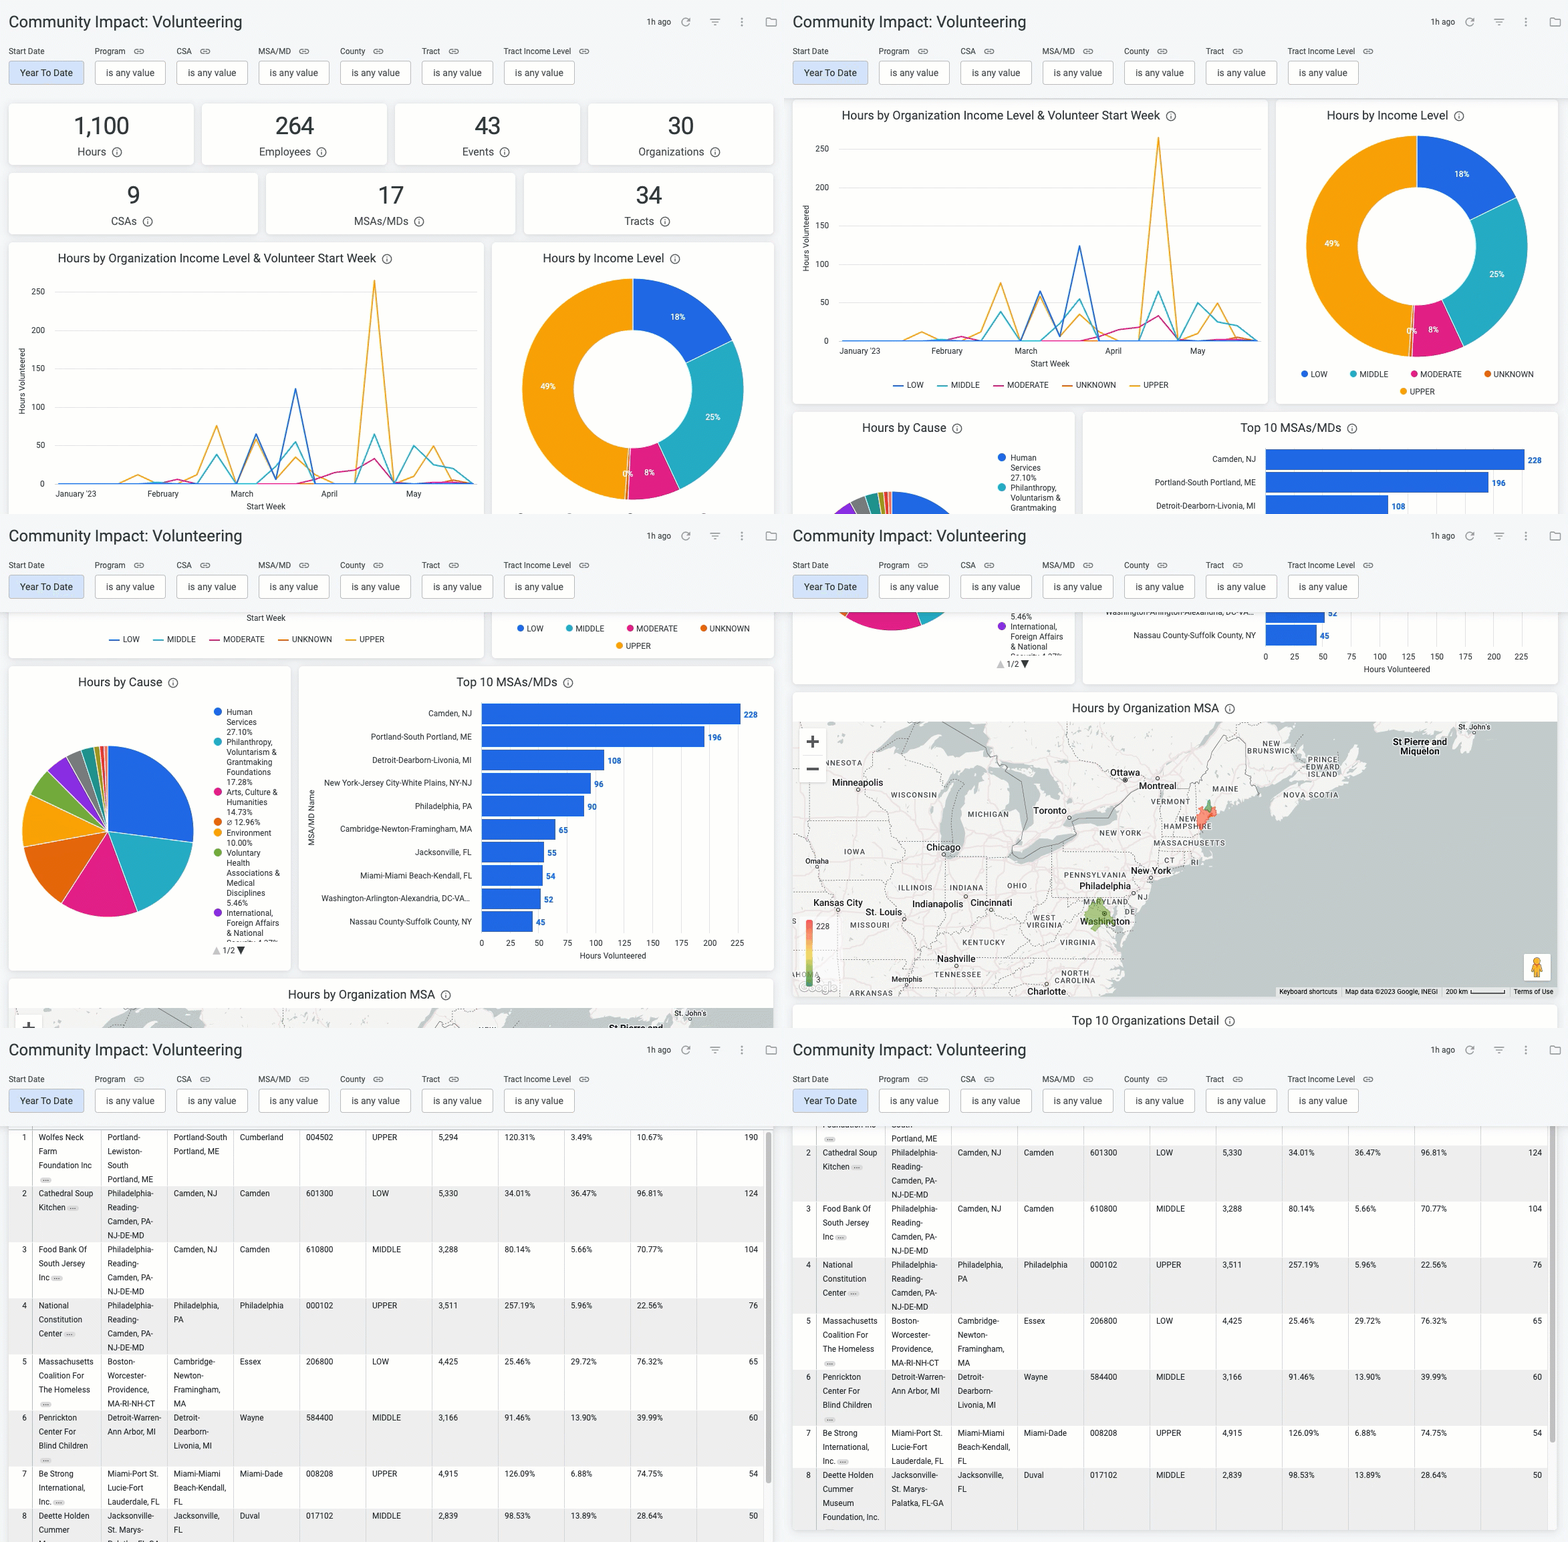
The Community Impact: Volunteering Dashboard includes the following filters and visualizations:
Filters:
- Volunteer Start Date
- Program
- CSA
- MSA
- County
- Tract
- Tract Income Level
Visualizations:
- Total Hours
- Total Participating Employees
- Total Events
- Unique Organization Count
- Unique MSA Count
- Unique Tract Count
- Hours by Tract Income Level & Approval Week
- Hours % by Tract Income Level
- Hours % by Organization Cause
- Top 10 MSAs by Total Hours
- Hours by Organization MSA (heatmap)
- Top 10 Organizations Detail by Total Hours
What else do you need help with?
Not what you're looking for? Navigate to Understanding CRA Reporting within Insights


