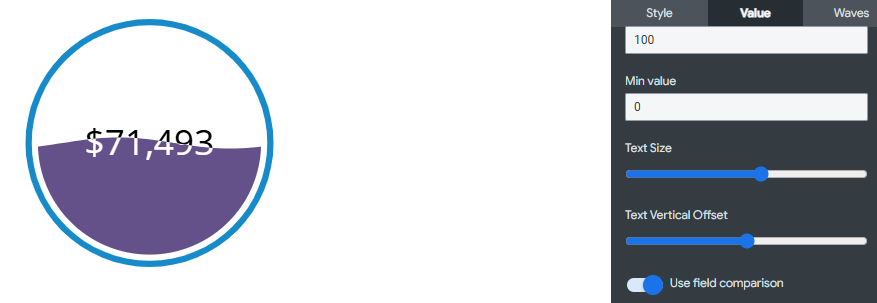
The Value Menu in the Liquid Fill Gauge Visualization of an Insights Explore allows users to customize the appearance and functionality of the gauge to best represent their program data and reporting requirements. This menu provides a range of options, including the ability to display the progress as a percentage or total value, set the maximum and minimum values, adjust the text size and placement, and enable field comparison to utilize two measure fields within the data set.
Proceed as follows to utilize the Value Menu in the Liquid Fill Gauge Visualization.
Step 1: Access a report through an Insights Explore
Log in to the CyberGrants platform and navigate to the Insights tab.

In the left-hand menu, select the "Analyze" option to view and choose from the available Explores.
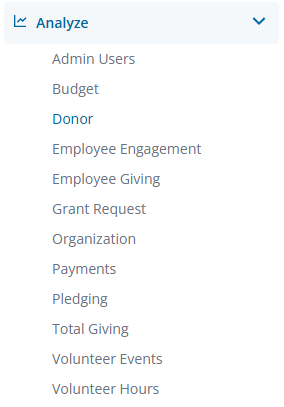
Create a new report by either building it from scratch by adding relevant fields or if any prebuilt Quick Start reports are available, select one of those as a starting point
Step 2: View the Liquid Fill Gauge Visualization Value Menu
Use the ellipsis in the Visualization toolbar to access the Liquid Fill Gauge Visualization type.
Click Edit in the right corner of the Visualization toolbar to access the Liquid Fill Gauge Visualization Value Menu options.
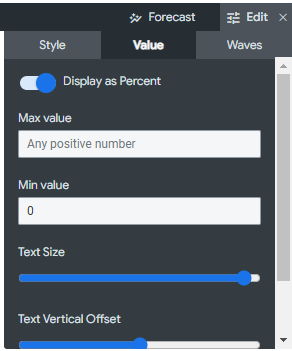
Step 3: Display as Percent or Total Value
Determine whether the progress should be represented as a percentage or a total value.
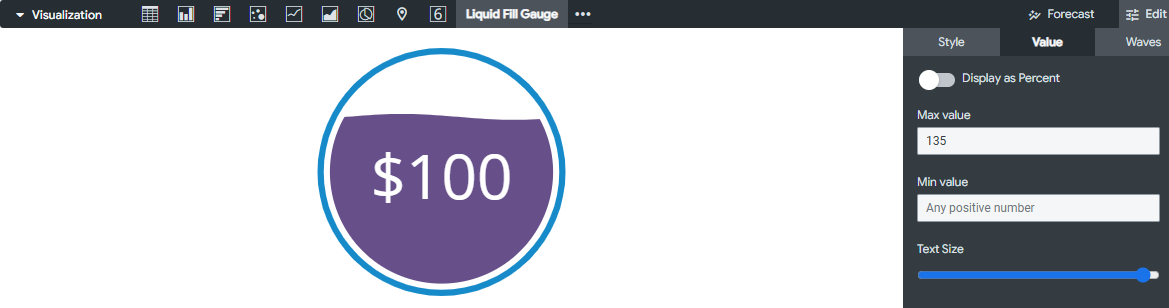
- Display as Percentage (toggled on):
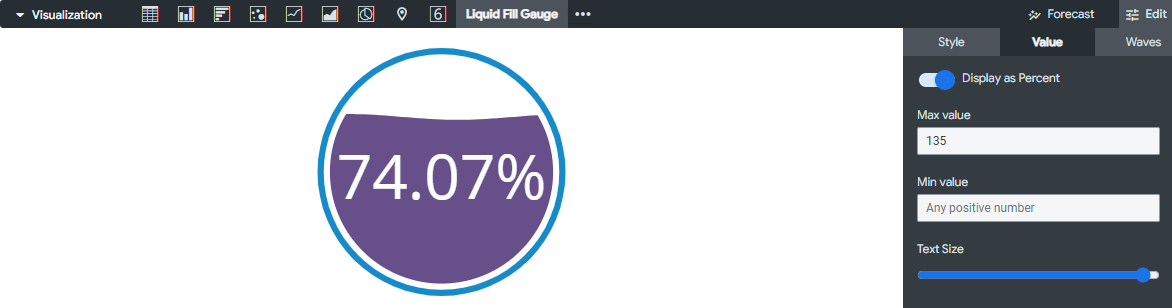
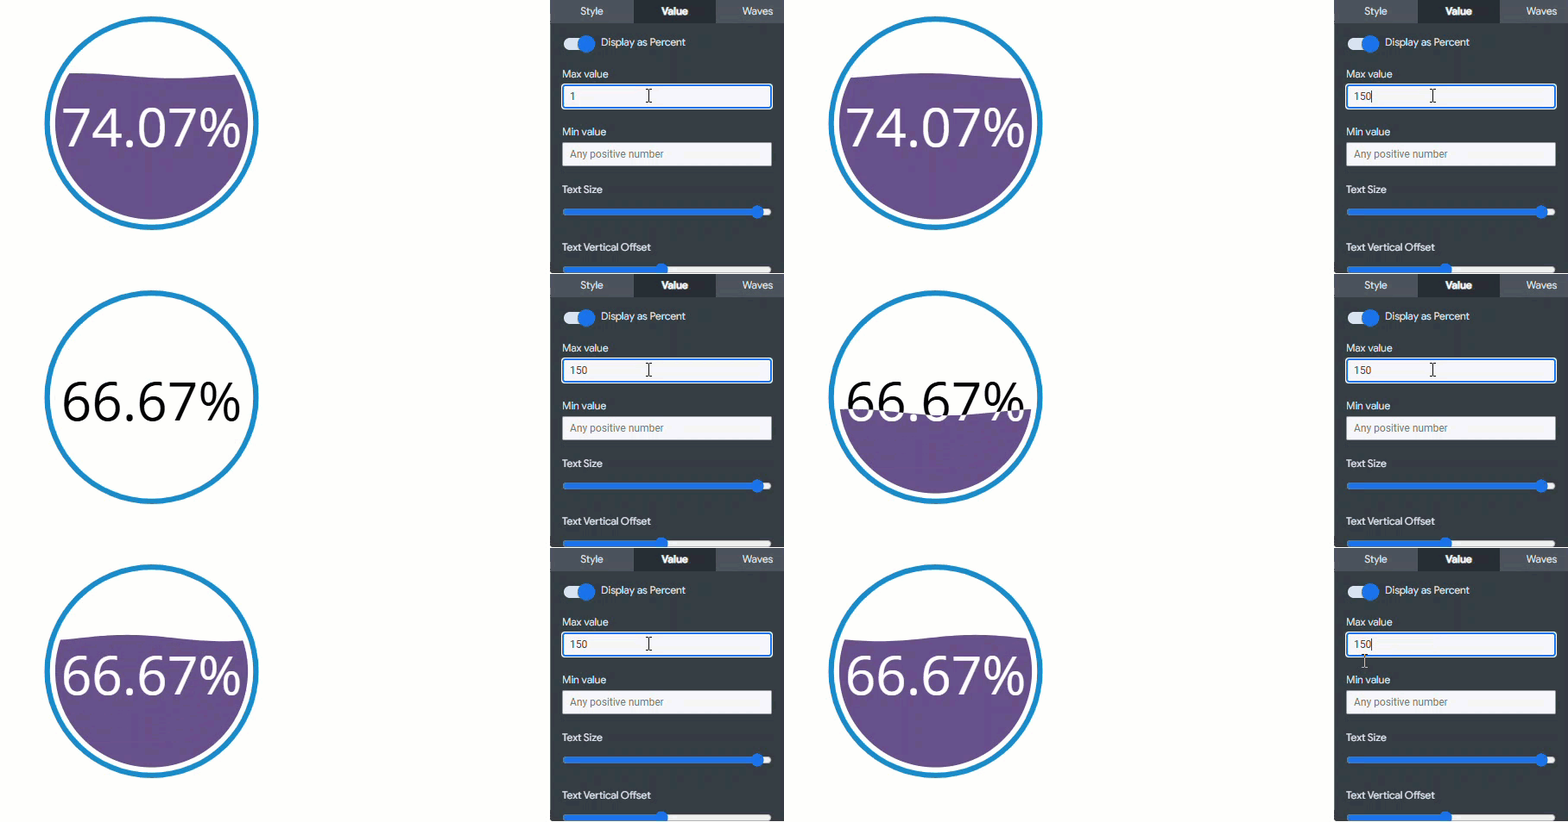
Step 4: Set the Max Value
Manually enter a projected goal amount to which the actual amount will be compared.
- NOTE: Users can manually adjust the "max value" parameter to customize the view of the Liquid Fill Gauge and represent the target or maximum value that the gauge is designed to depict, allowing them to tailor the visualization to align with their specific program data and reporting requirements.
Step 5: Adjust the Minimum Value
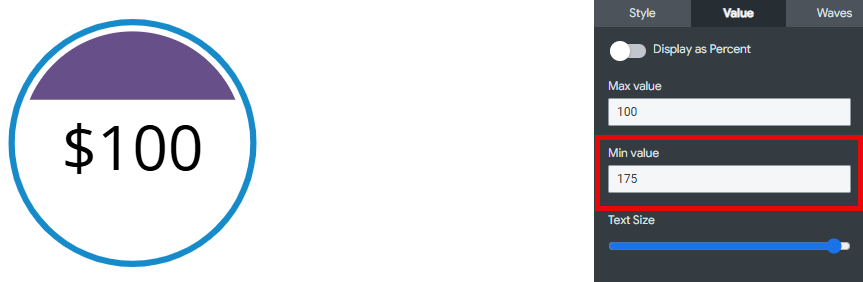
The "Min Value" feature allows users to input a minimum value to further customize the view of the gauge.
Step 6: Modify the Text Size
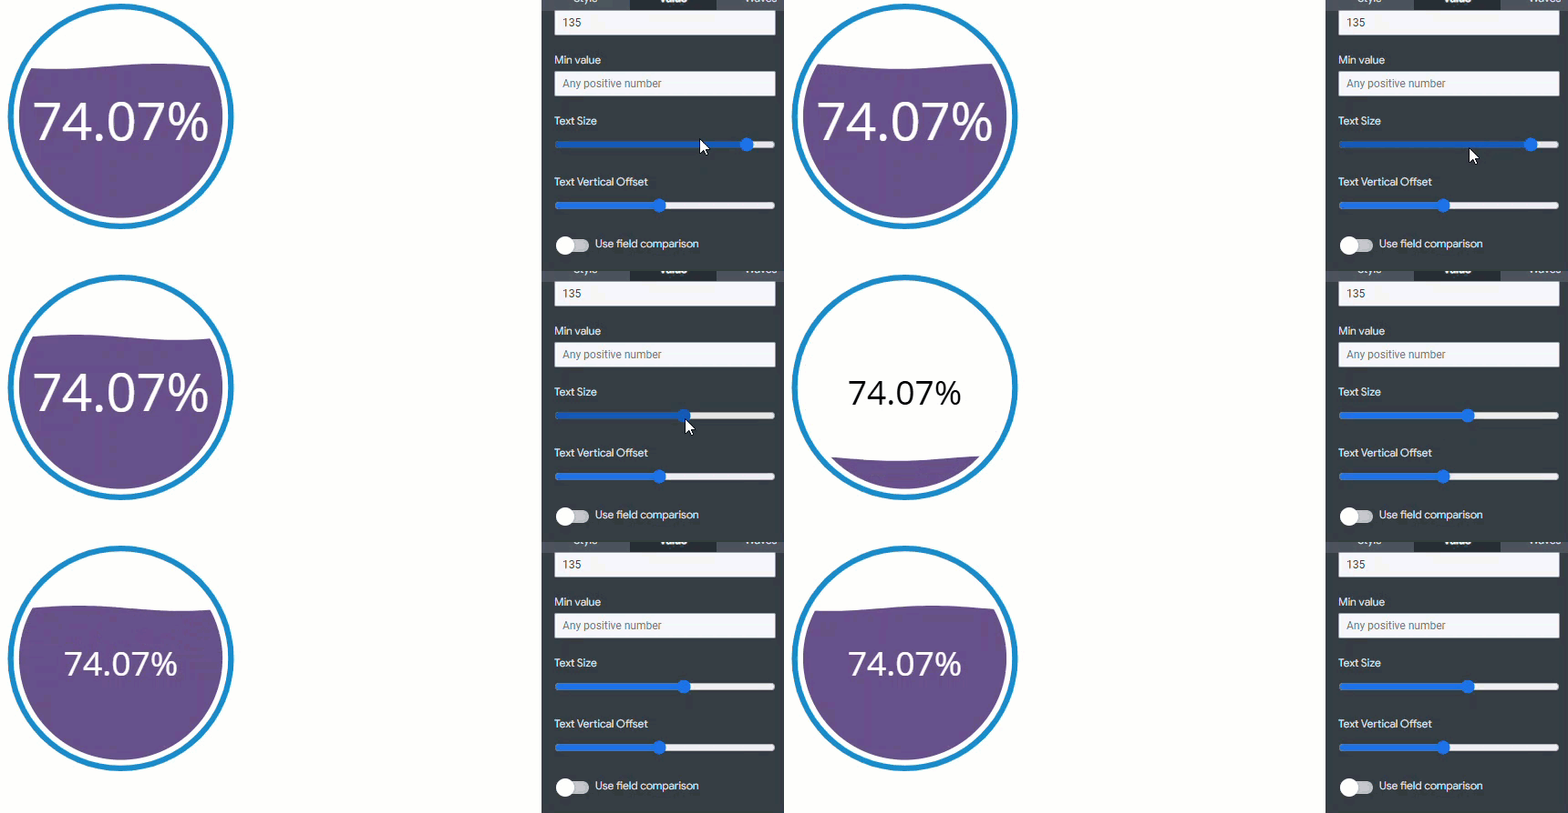
Users can adjust the size of the text displayed within the gauge.
Step 7: Optimize the Text Vertical Offset
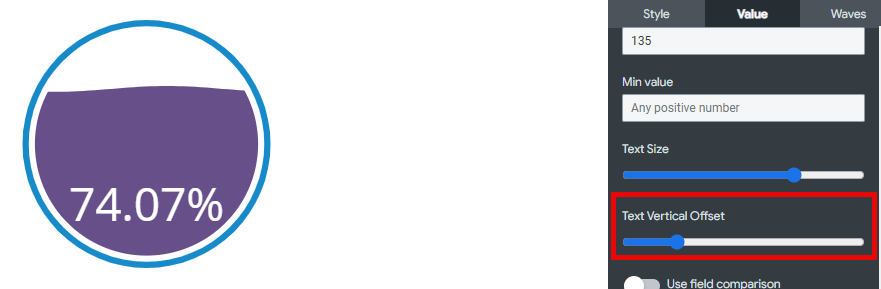
The placement of the text within the liquid fill gauge can be adjusted.
Step 8: Enable Field Comparison
The "Use Field Comparison" option can be toggled on to utilize two measure fields within a data set, as opposed to manually entering a goal amount.
What else do you need help with?
Not what you're looking for? Navigate to Understanding the Insights Liquid Fill Gauge Visualization


