Salesforce

How do I use the Waves Menu in a Liquid Fill Gauge Visualization?

« Go Back
Information
How do I use the Waves Menu in a Liquid Fill Gauge Visualization?
How-do-I-use-the-Waves-Menu-in-a-Liquid-Fill-Gauge-Visualization
Details

The Waves Menu in a Liquid Fill Gauge Visualization within an Insights Explore allows users to customize the animation and appearance of the waves in the gauge. This menu provides settings to control the wave's animation, including the ability to animate the wave, and adjust the wave's scale, speed, count, height, and offset. Users can also enable the wave to rise from the bottom when the visualization updates, and adjust the speed of this rising motion.

Proceed as follows to access the Wave menu and select from various settings to adjust how the wave animation is visually represented within the Liquid Fill Gauge visualization.

Step 1: Access a report through an Insights Explore 

Log in to the CyberGrants platform and navigate to the Insights tab. 

In the left-hand menu, select the "Analyze" option to view and choose from the available Explores.

Create a new report by either building it from scratch by adding relevant fields or if any prebuilt Quick Start reports are available, select one of those as a starting point

Step 2: View the Liquid Fill Gauge Visualization Waves Menu

Use the ellipsis in the Visualization toolbar to access the Liquid Fill Gauge Visualization type.

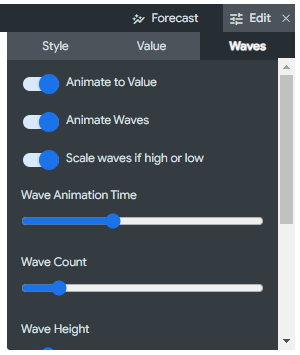
Click Edit in the right corner of the Visualization toolbar to access the Liquid Fill Gauge Visualization Waves Menu options.
Step 3: Animate to Value

Toggle on the "Animate to value" option to update the gauge and animate the value, allowing it to increase from 0 when the visualization updates.
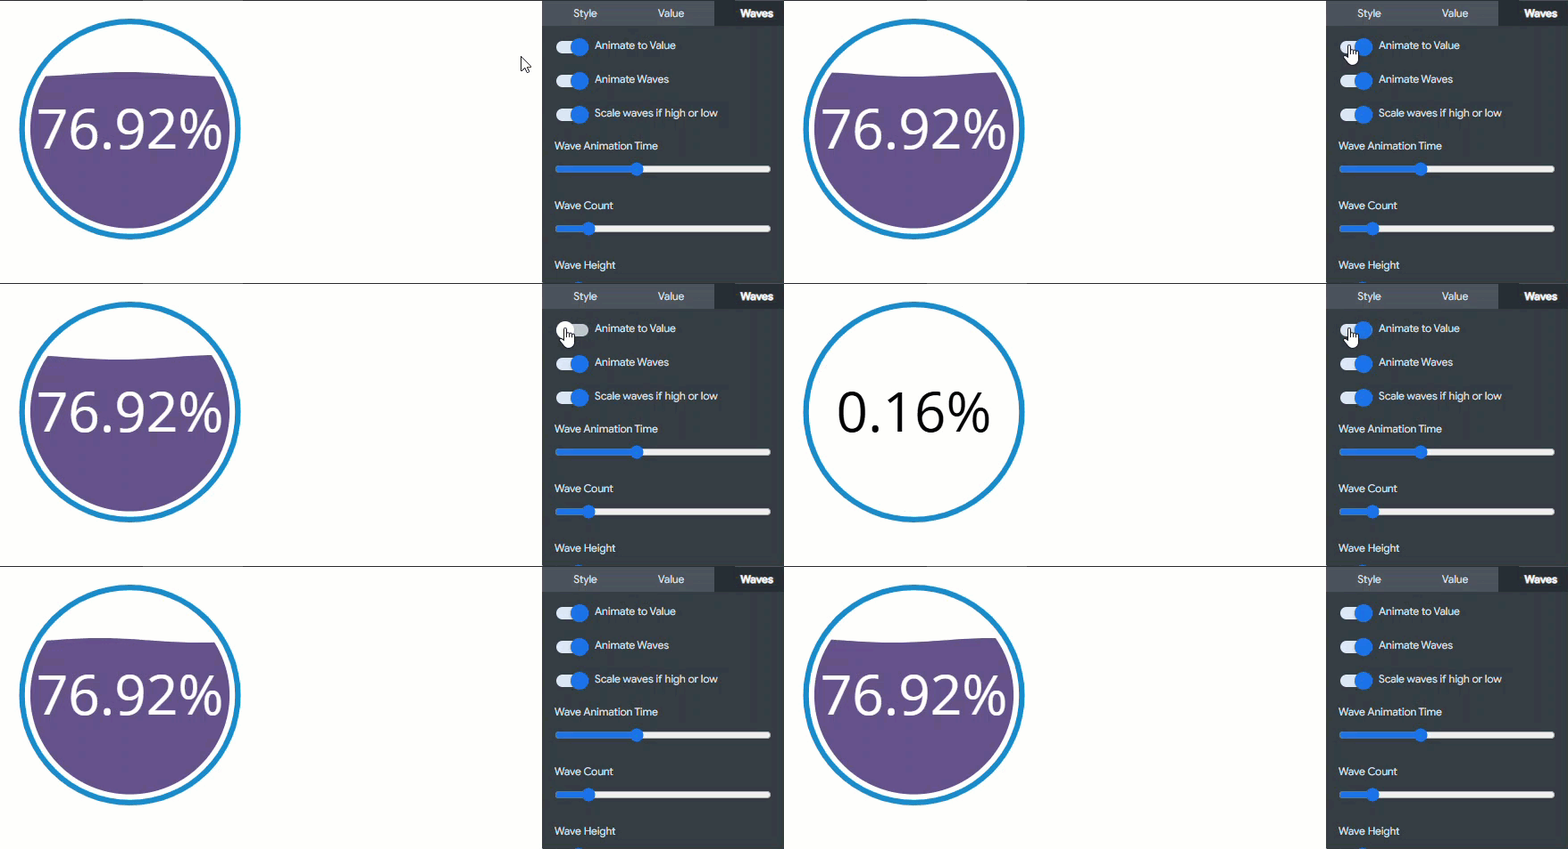
animate to value in waves menu of a liquid fill gauge visualization123.gif

Step 4: Animate Waves

Toggle on the "Animate waves" option to update the gauge and animate the wave, making it move in the visualization instead of staying still.
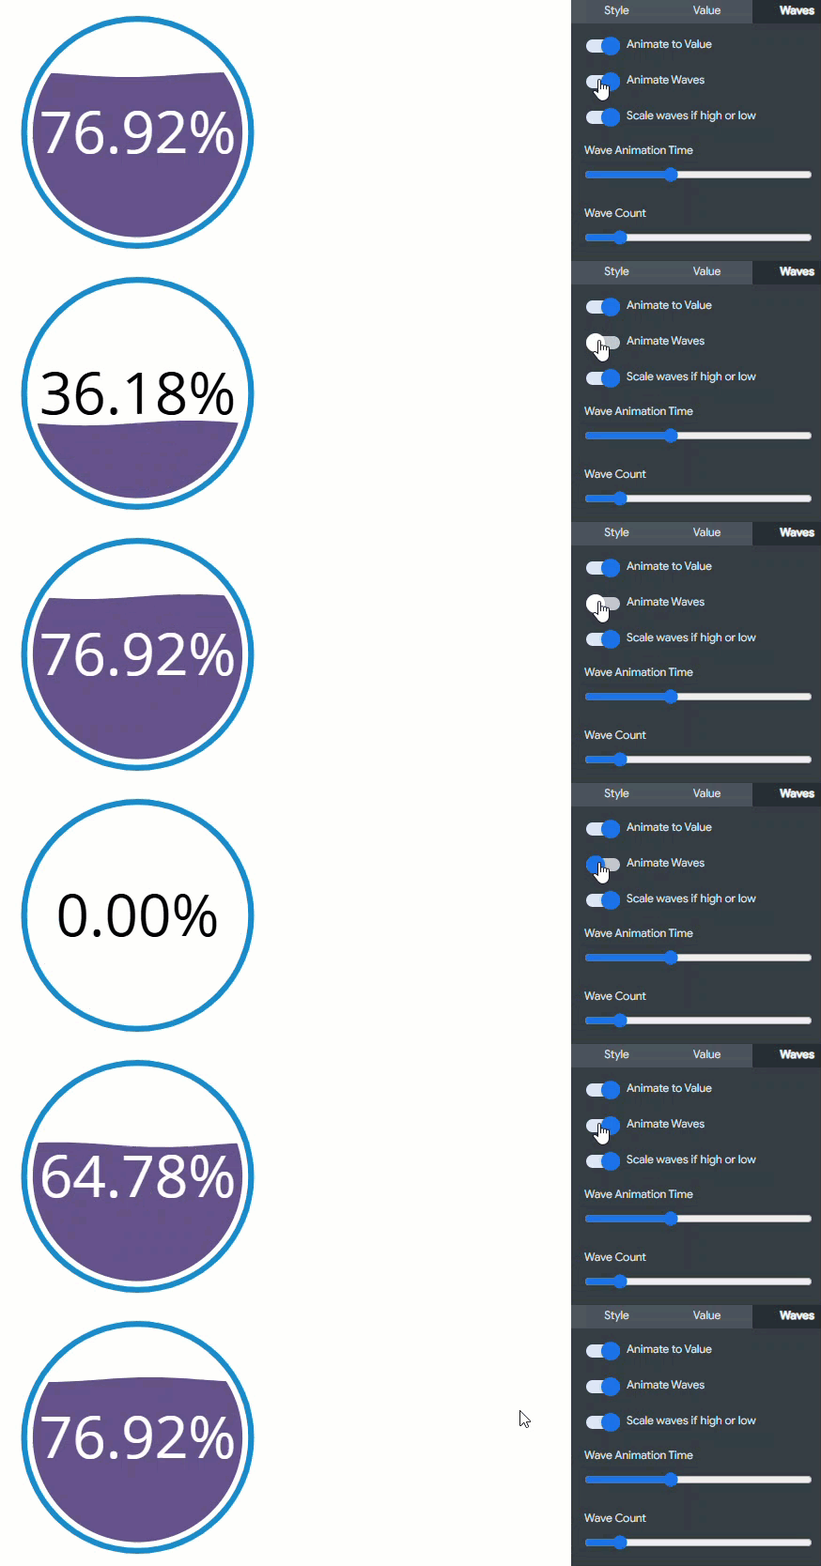
animate waves in waves menu of a liquid fill gauge visualization123.gif

Step 5: Scale Waves if High or Low

Determine if the scale of the wave should be high or low based on the value represented in the visualization.
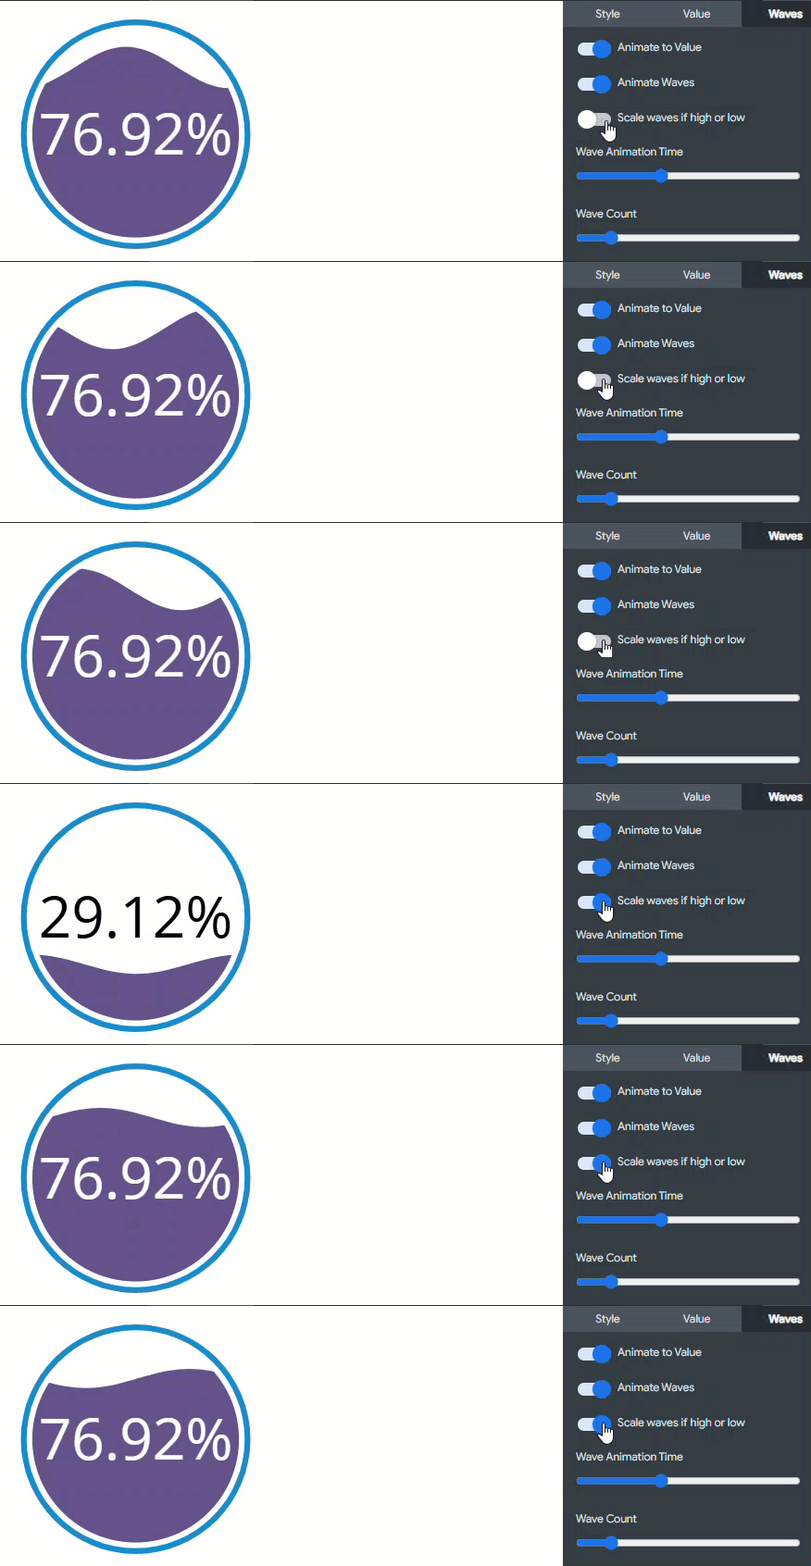
scale waves high or low in waves menu of a liquid fill gauge visualization123.gif

Step 6: Change the Wave Animation Time

Adjust the "Wave animation time" to control the speed of the wave when the "Animate waves" option is toggled on.
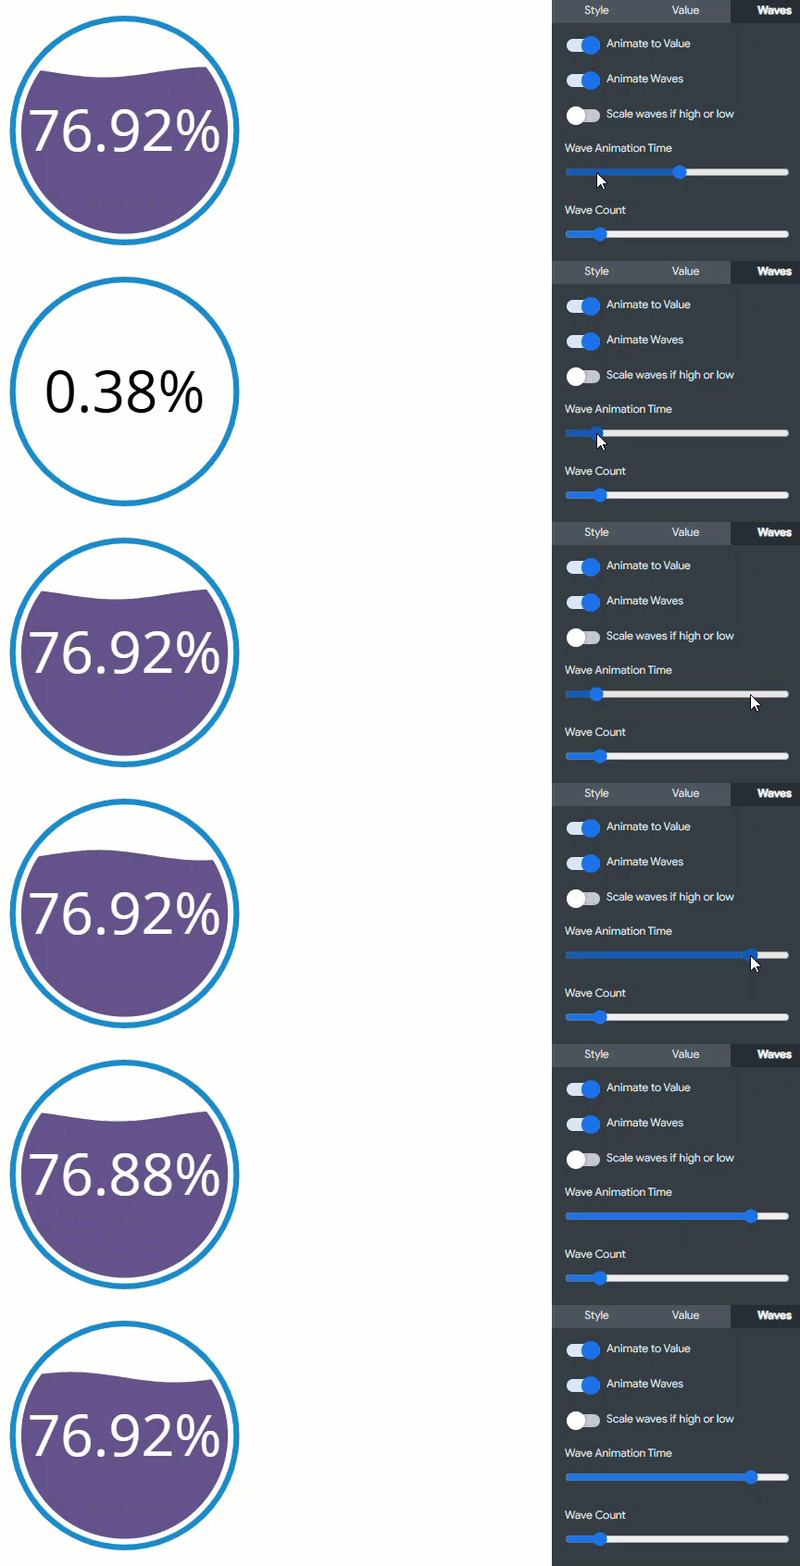
change wave animation time in waves menu of a liquid fill gauge visualization123.gif

Step 7: Update the Wave Count

Increase or decrease the "Wave count" to adjust the number of waves represented in the visualization.
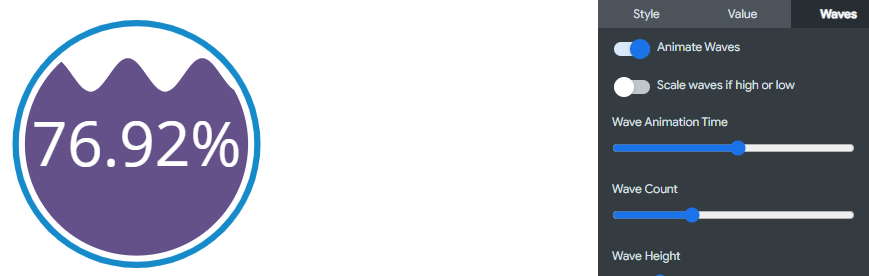
Step 8: Adjust the Wave Height

Adjust the "Wave height" to determine the height of the waves.
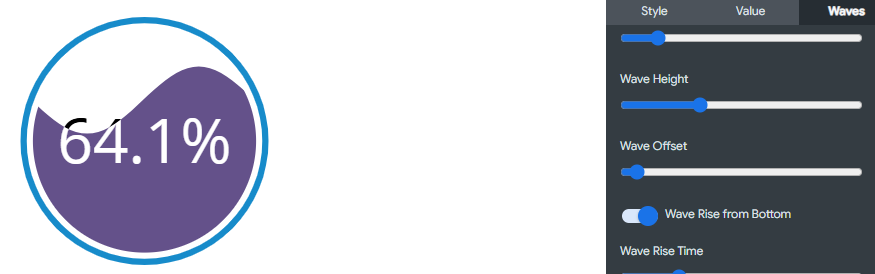
Step 9: Determine the Wave Offset

If the "Animate waves" option is toggled off, use the "Wave offset" setting to determine how the wave should be visualized.
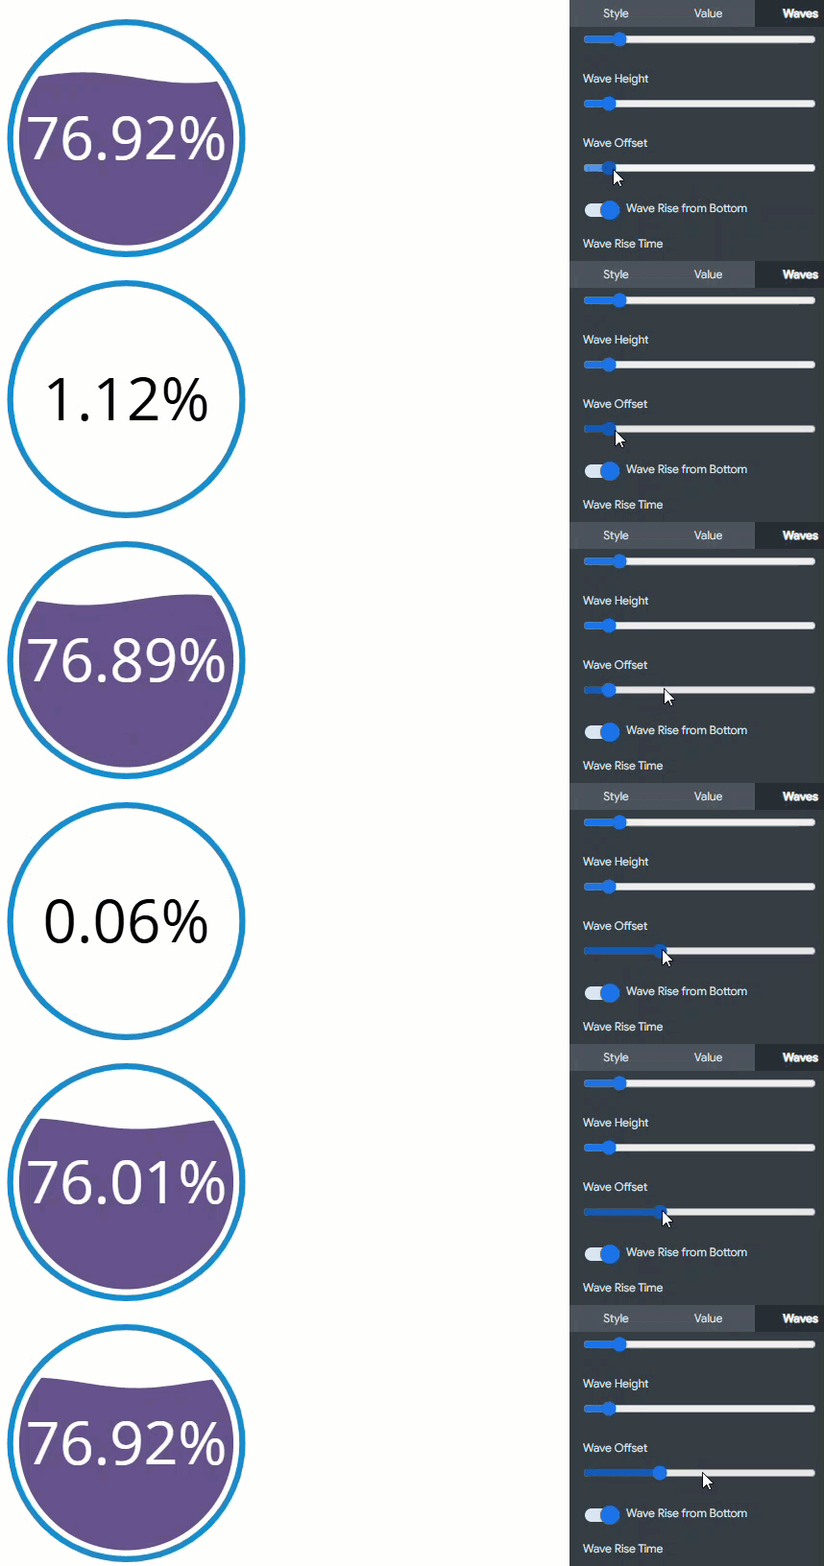
wave offset in waves menu of a liquid fill gauge visualization123.gif

Step 10: Enable Wave Rise

The "Wave rise from bottom" option allows the wave to rise from the bottom when the visualization updates, and if enabled, the rising speed wave can be adjusted.

  • Wave Rise from Bottom - Toggle on this option to make the wave rise from the bottom when the visualization updates.
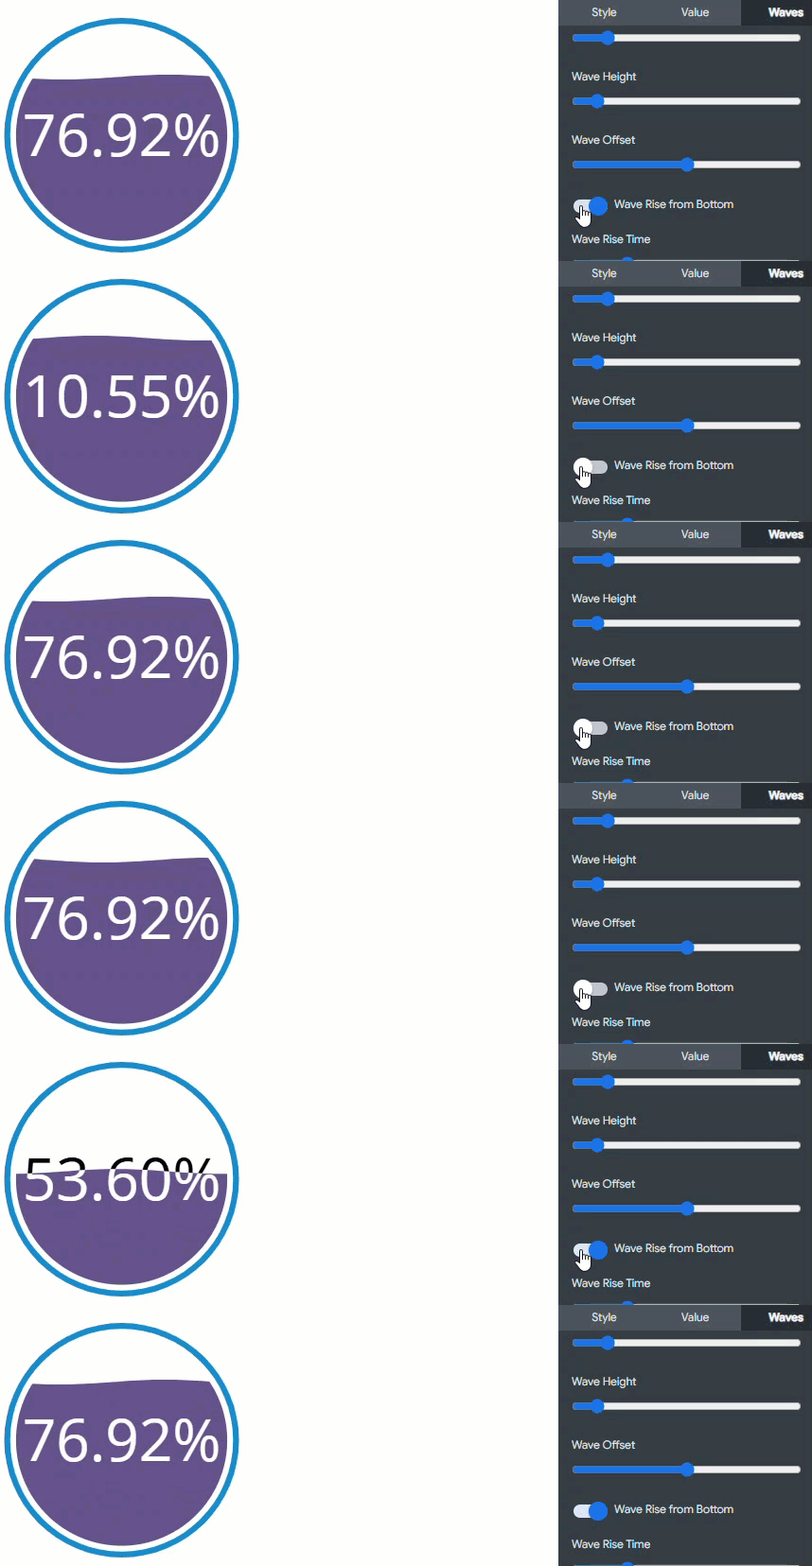
wave rise in waves menu of a liquid fill gauge visualization123.gif

  • Wave Rise Time - If "Wave rise from bottom" is toggled on, adjust the speed at which the wave will rise from the bottom when the visualization updates.
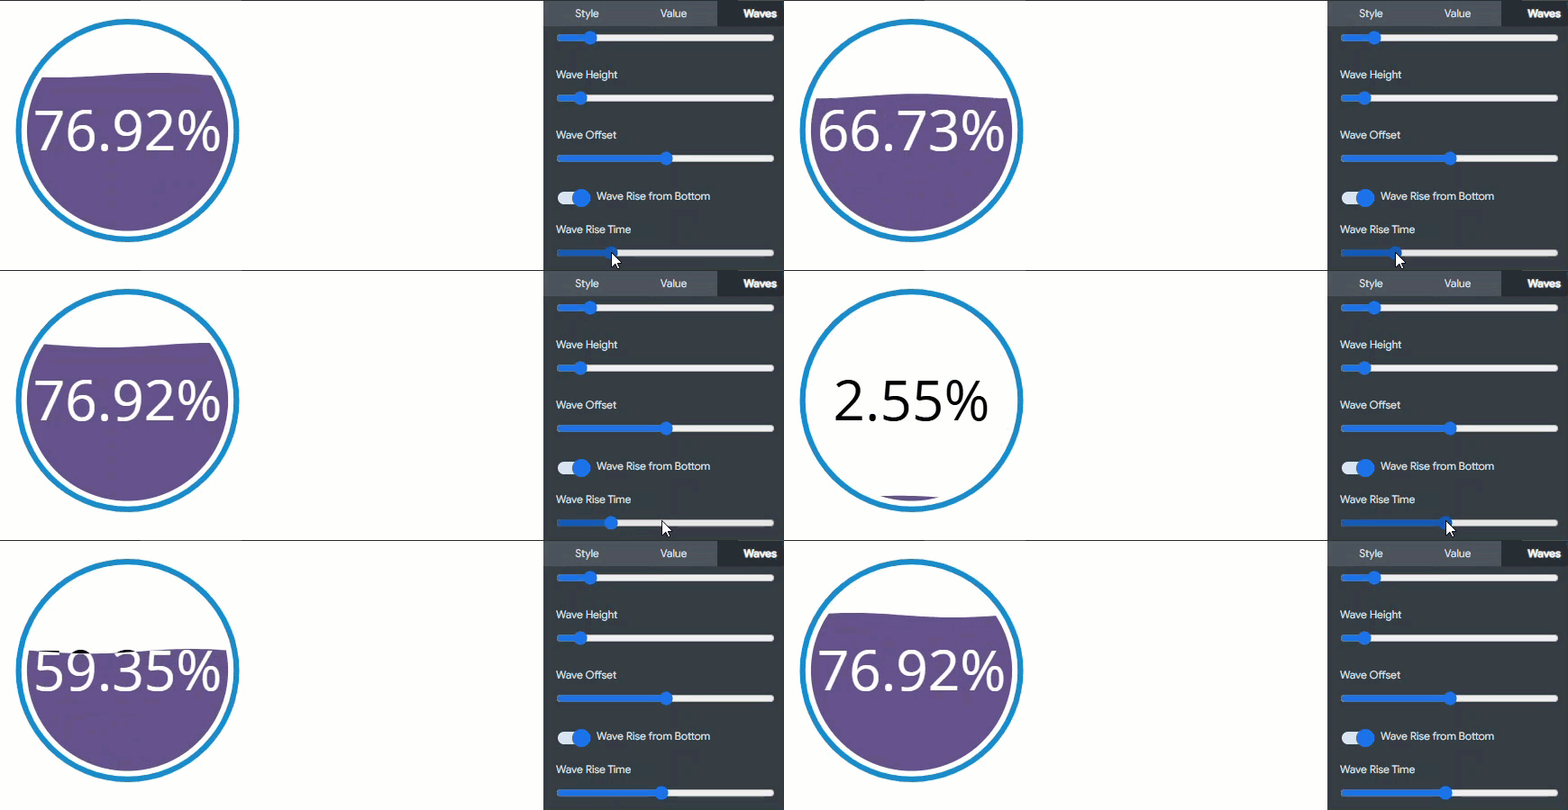
wave rise time in waves menu of a liquid fill gauge visualization123.gif


What else do you need help with?

Not what you're looking for? Navigate to Understanding the Insights Liquid Fill Gauge Visualization



Powered by