Liquid Fill Gauge Visualization Overview
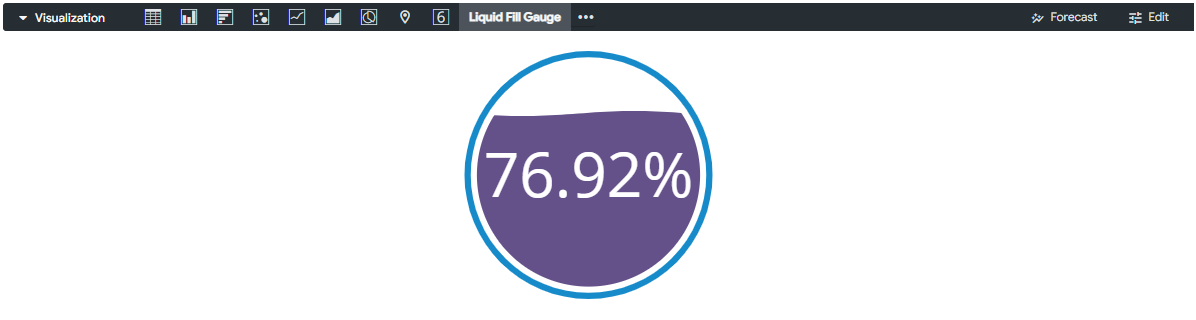
The Insights Liquid Fill Gauge Visualization provides users with a dynamic way to display progress toward a goal or target value. This type of gauge allows for a visual representation of actual values compared to a projected or desired outcome, enabling users to quickly assess performance and identify areas for improvement.
Insights users can leverage the Liquid Fill Gauge Visualization to enhance their data analysis and reporting capabilities. To customize the view of the Liquid Fill Gauge Visualization, users can manually adjust the "max value" parameter to represent the target or maximum value that the gauge is designed to depict. By modifying the "max value," users can tailor the visual elements of the gauge, including the color scheme and wave size, to align with their specific data and reporting requirements.
Feature Availability:
The Insights Visualization Types available within Insights Explores are accessible only to Insights Analysts. Administrators can manage Insights permissions for their program's internal users through the Users section in the Insights platform. Click Here to learn more about the Insights Self-Service User Management Portal.
To learn more about the Insights Liquid Fill Gauge Visualization, visit the articles below.
What do you need help with?
What else do you need help with?
Not what you're looking for? Navigate to Insights Visualization Types Overview


