The Insights platform offers users the ability to analyze their mappable data through a Google Map Visualization and display their program information in an interactive geographical format. To access this functionality and leverage its features, follow the instructions below.
Step 1: Access the Insights tab and Choose an Explore
Log in to the CyberGrants platform and navigate to the Insights tab.

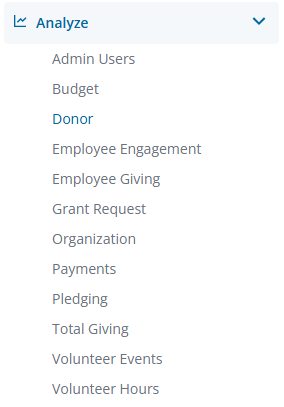
In the left-hand menu, select the "Analyze" option to view and choose from the available Explores.
Step 2: Build or select a report
Create a new report by either building it from scratch by adding relevant fields or if any prebuilt Quick Start reports are available, select one of those as a starting point.
- All mappable location fields can be identified by the globe icon 🌎 displayed next to the field name. However, if you have renamed any location-based standard fields, the custom name will override the globe icon displayed.
Step 3: Enable the Google Maps Visualization
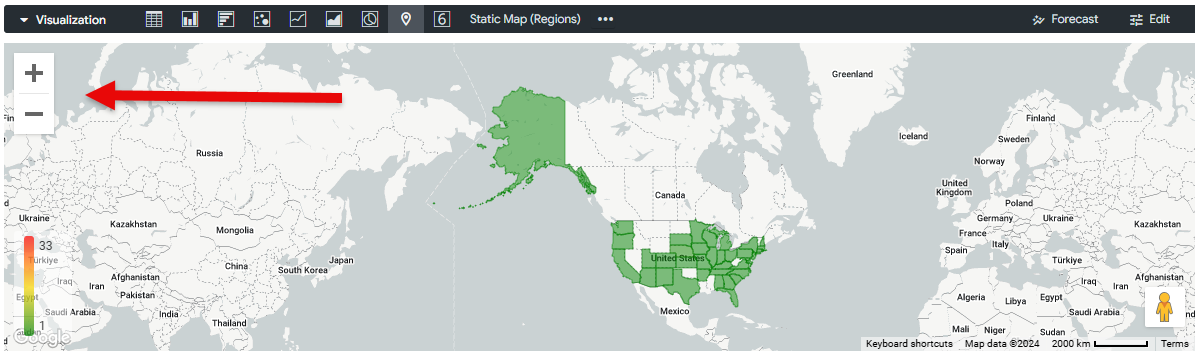
Choose Google Maps from the chart types available in the Visualization toolbar to view the data in a geographical format.
Step 4: Zoom In and Out
Use the +/- icons to zoom in and out of the map.
Step 5: Interpret the Heatmap Gauge
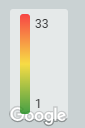
Locate the heatmap gauge in the bottom left corner of the map visualization to understand the data density.
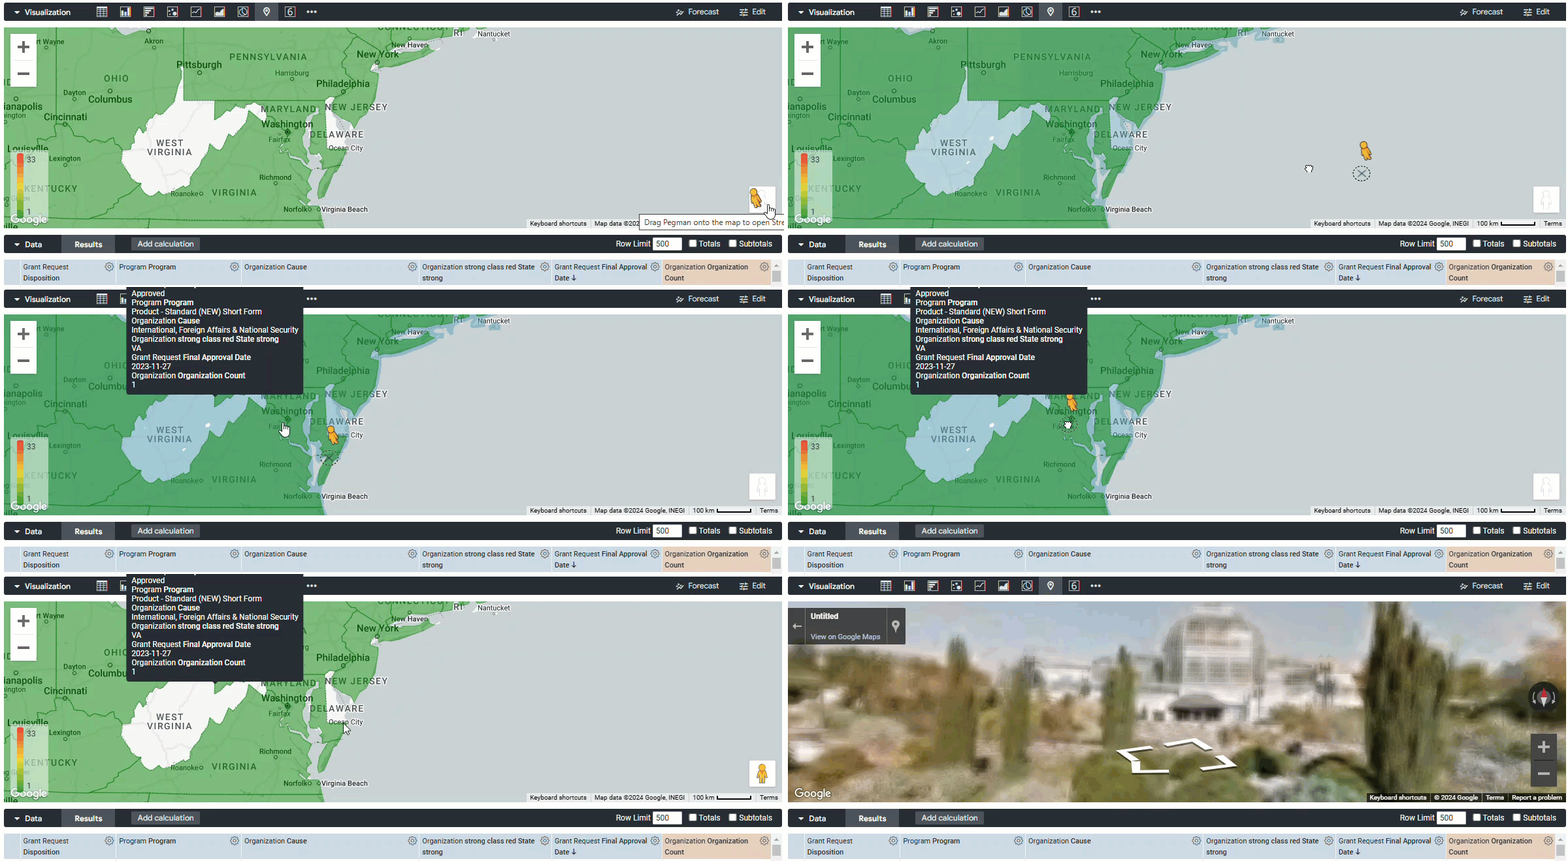
Step 6: Activate the Street View
In the bottom right corner of the map visualization, you will see the Pegman icon, which represents the Google Street View functionality. Click and drag the Pegman icon to the location on the map that you want to zoom into to view the Google Street View.
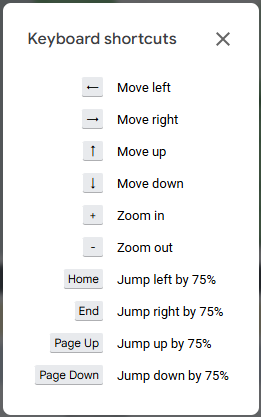
Step 7: Utilize Keyboard Shortcuts
Familiarize yourself with the available keyboard shortcuts to enhance your map navigation experience.
Step 8: Adjust the Map Scale Units
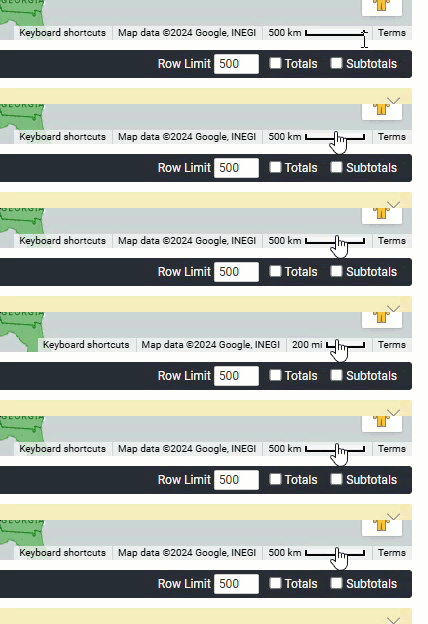
Switch between Metric (m, km) or Imperial (ft, mi) units to suit your preferences.