Google Maps Visualization Overview
Google Maps Visualization in Insights Explores enables users to visualize geographic data on responsive and interactive maps. These charts require at least one dimension that is based on geographic data, allowing users to analyze and understand the spatial relationships within their program data. Users have access to a variety of plot menu options, map menu options, and value menu options to customize the map visualization to their specific needs, including adjusting the map style, centering the map, setting color ranges, and more.
Feature Availability:
The Insights Visualization Types available within Insights Explores are accessible only to Insights Analysts. Administrators can manage Insights permissions for their program's internal users through the Users section in the Insights platform. Click Here to learn more about the Insights Self-Service User Management Portal.
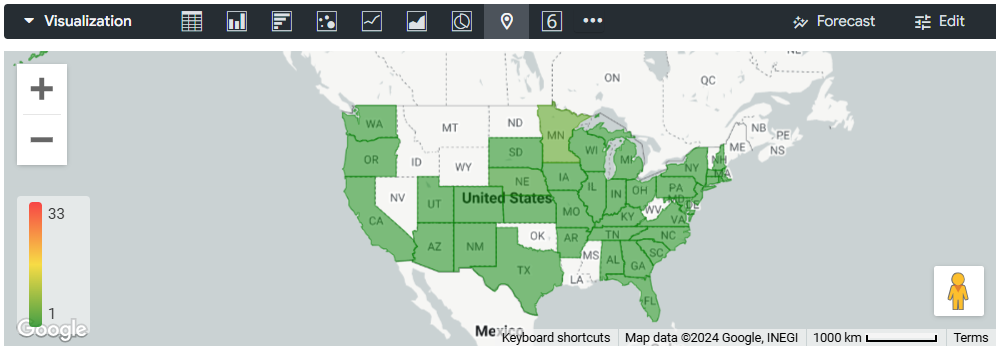
To learn more about the Insights Google Maps Visualization and options to customize your view of geographical data in an Explore using this feature, please view the articles below.
What do you need help with?
What else do you need help with?
Not what you're looking for? Navigate to Insights Visualization Types Overview


