The Map menu in a Google Map Visualization allows Insights users to customize the map style, adjust the map position, enable panning and zooming, and configure tooltip settings, all of which can improve the clarity and impact of geographical program data visualizations.
Proceed as follows to leverage the Map menu in an Insights Google Map Visualization and enhance the visual representation of your data.
Step 1: Access a report through an Insights Explore
Log in to the CyberGrants platform and navigate to the Insights tab.

In the left-hand menu, select the "Analyze" option to view and choose from the available Explores.
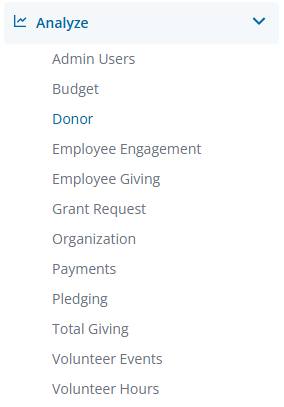
Create a new report by either building it from scratch by adding relevant fields or if any prebuilt Quick Start reports are available, select one of those as a starting point.
Step 2: View the Google Maps Visualization Map Menu
Use the ellipsis in the Visualization toolbar to access the Google Maps Visualization type.

Click Edit in the right corner of the Visualization toolbar to access the Google Maps Visualization Map Menu options.
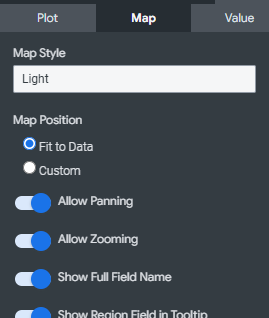
Step 3: Choose a Map Style:
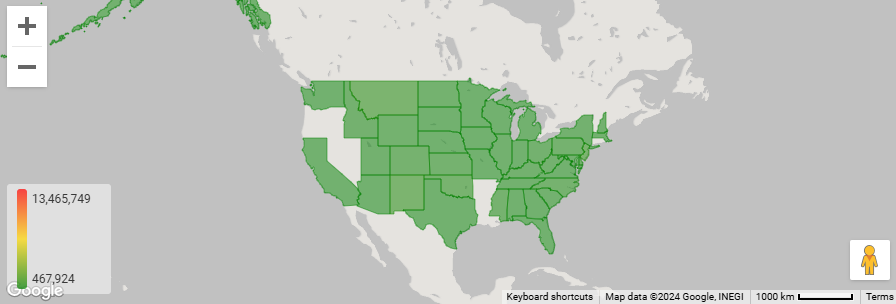
The Map Style empowers users to customize the background map and the display of map labels, such as cities and streets. The available options include:
- Light - A subtle, light-colored map designed to provide geographic context while highlighting your data.
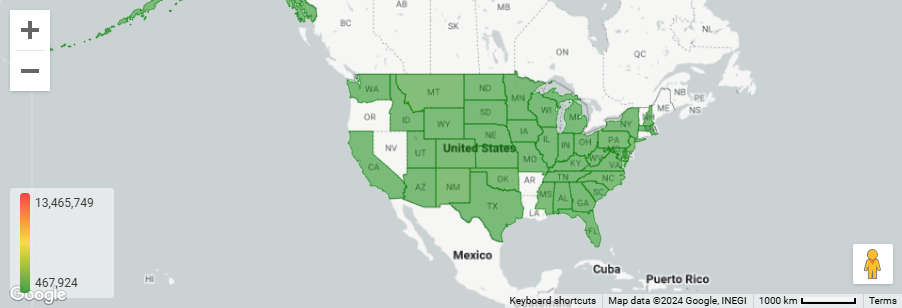
- Light (No Labels) - Similar to the Light option, but the map omits labels such as state and city names.
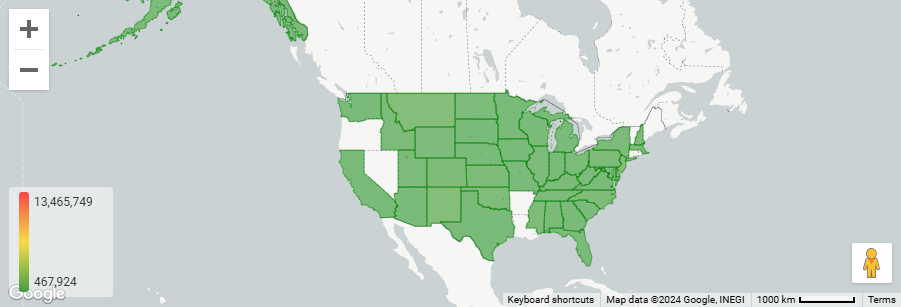
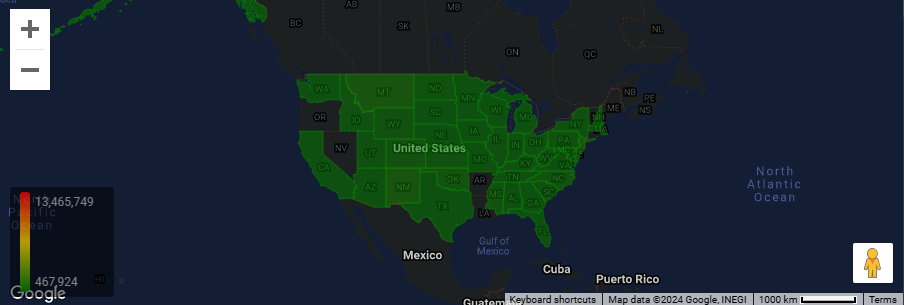
- Dark - A subtle, dark-colored map designed to provide geographic context while highlighting your data.
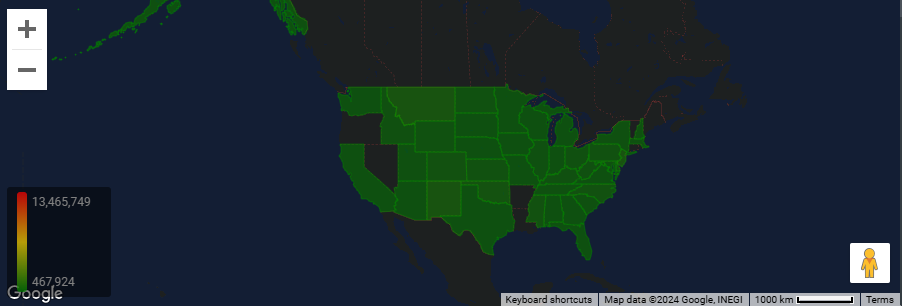
- Dark (No Labels) - Similar to the Dark option, but the map omits labels such as state and city names.
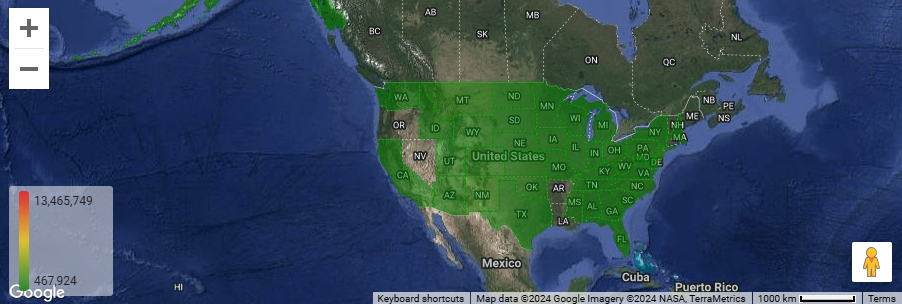
- Satellite - A map displaying global satellite and aerial imagery.
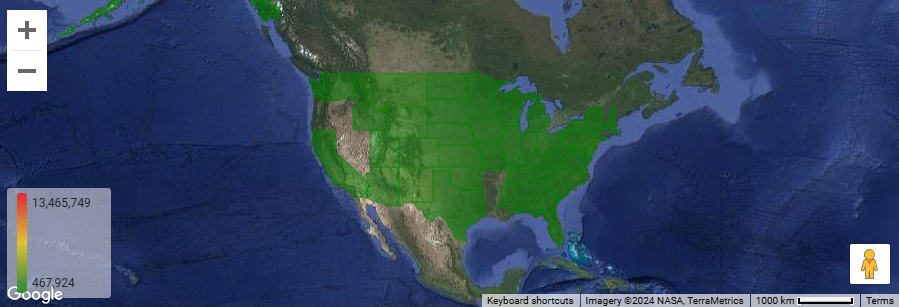
- Satellite (No Labels) - Similar to the Satellite option, but the map omits labels such as state and city names.
- Streets - A general-purpose map that emphasizes legible styling of road and transit networks.
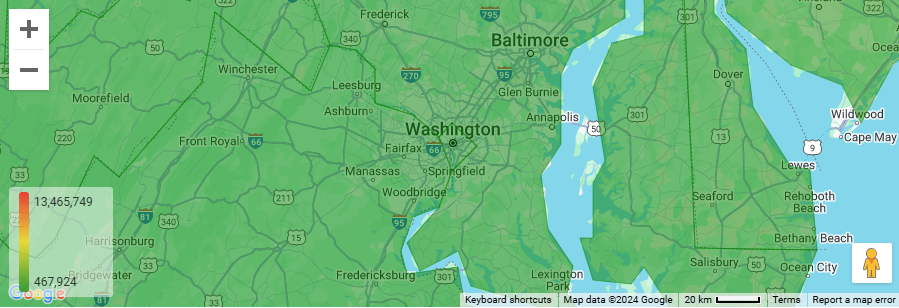
- Outdoors - A general-purpose map tailored to hiking, biking, and other outdoor uses.
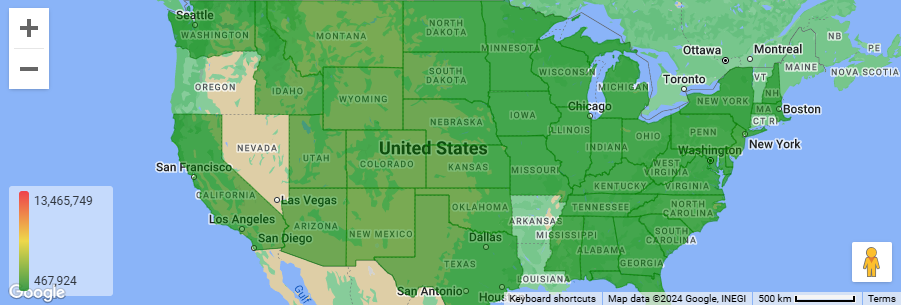
- Traffic (Day) - A light-colored map emphasizing transit networks and roads, including current traffic information.
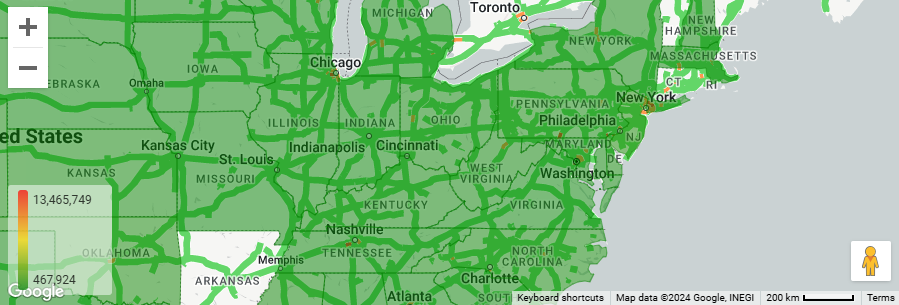
- Traffic (Night) - A dark-colored map emphasizing transit networks and roads, including current traffic information.
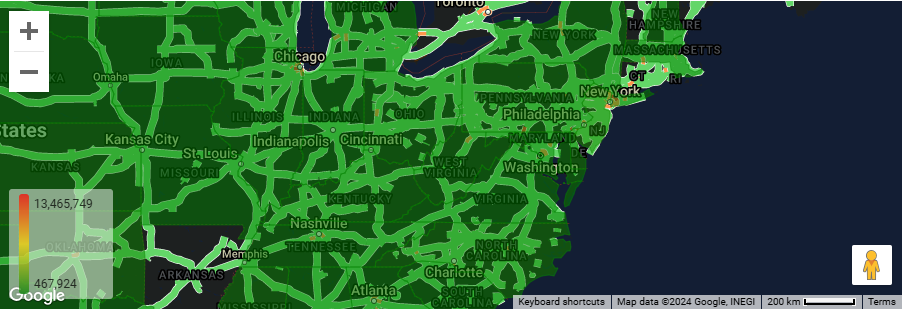
- Minimal - A light-themed map display with minimal information, excluding labels.
Step 4: Adjust the Map Position:
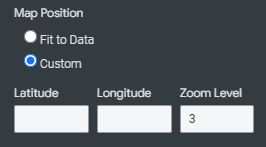
The Map Position can be adjusted to change the center point and zoom level of the visible map. Options include the following:
- Fit to Data - This option automatically centers and zooms the map so that your query's data points are visible.
- Custom - Manually set a Latitude, Longitude, and Zoom Level (higher numbers create a closer zoom level).
Step 5: Allow Panning and Zooming:
The Panning and Zooming features allow users to reposition the map by dragging it and/or using a (+/-) button to zoom in and out.
- Allow Panning - Determine whether users can reposition the map by dragging it. On by default.
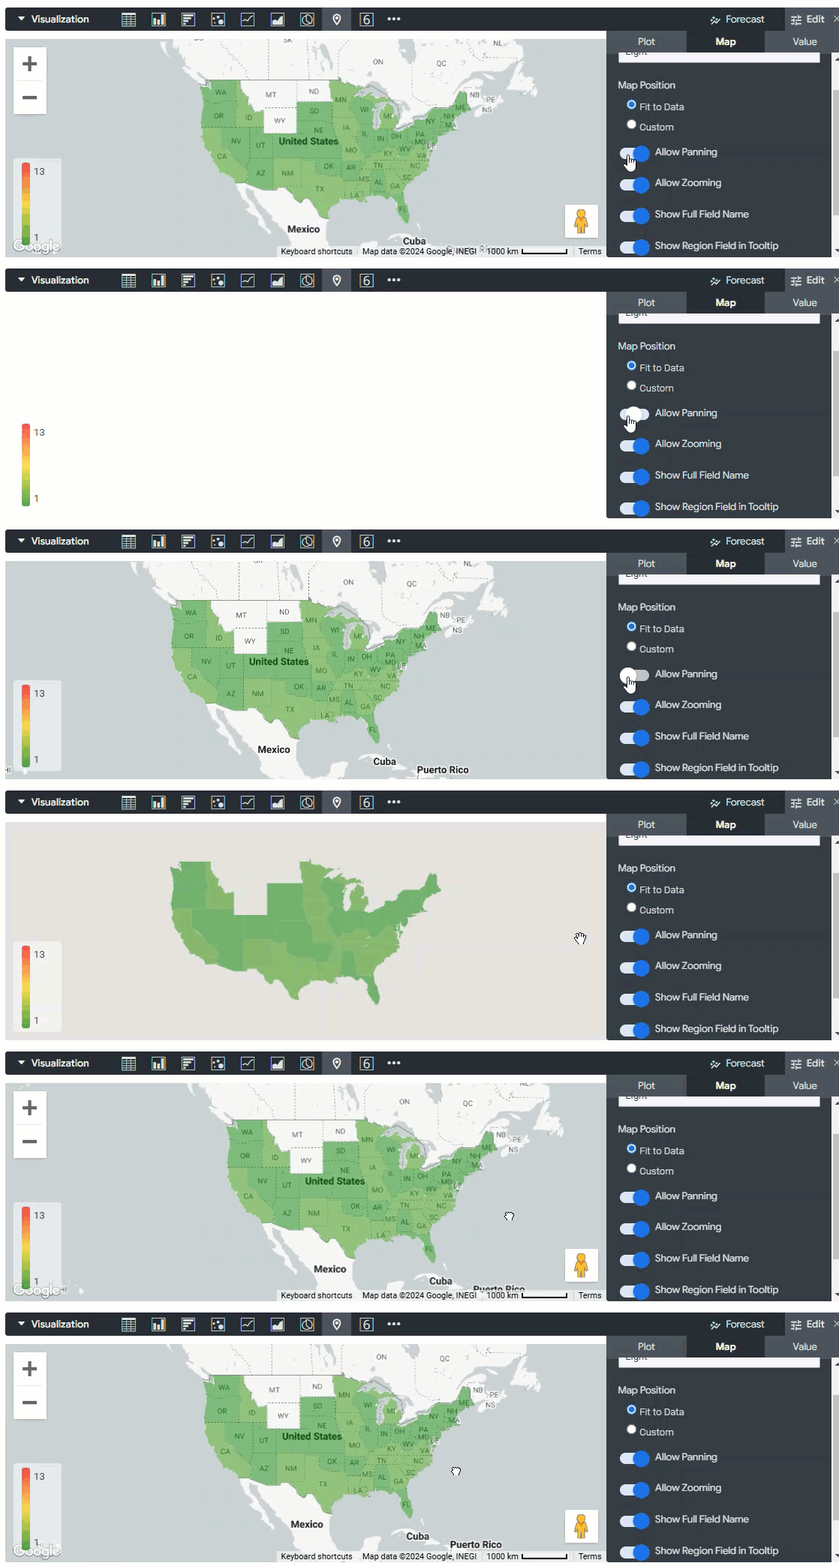
- Allow Zooming - Decide if a (+/-) button should be displayed in the upper left of the map visualization, allowing users to zoom in and out. On by default. You can also double-click on the map to zoom in if zooming is enabled.
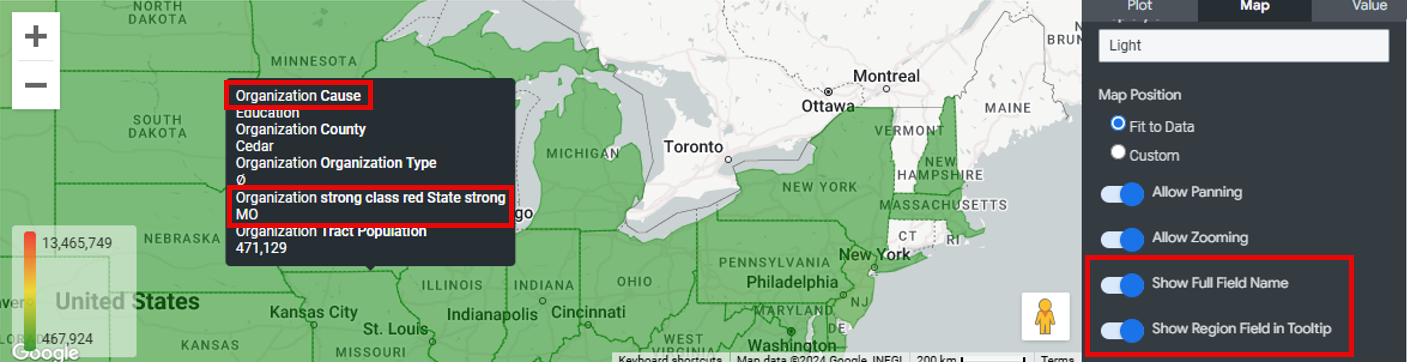
Step 6: Show Full Field Name and Region Field in Tooltip:
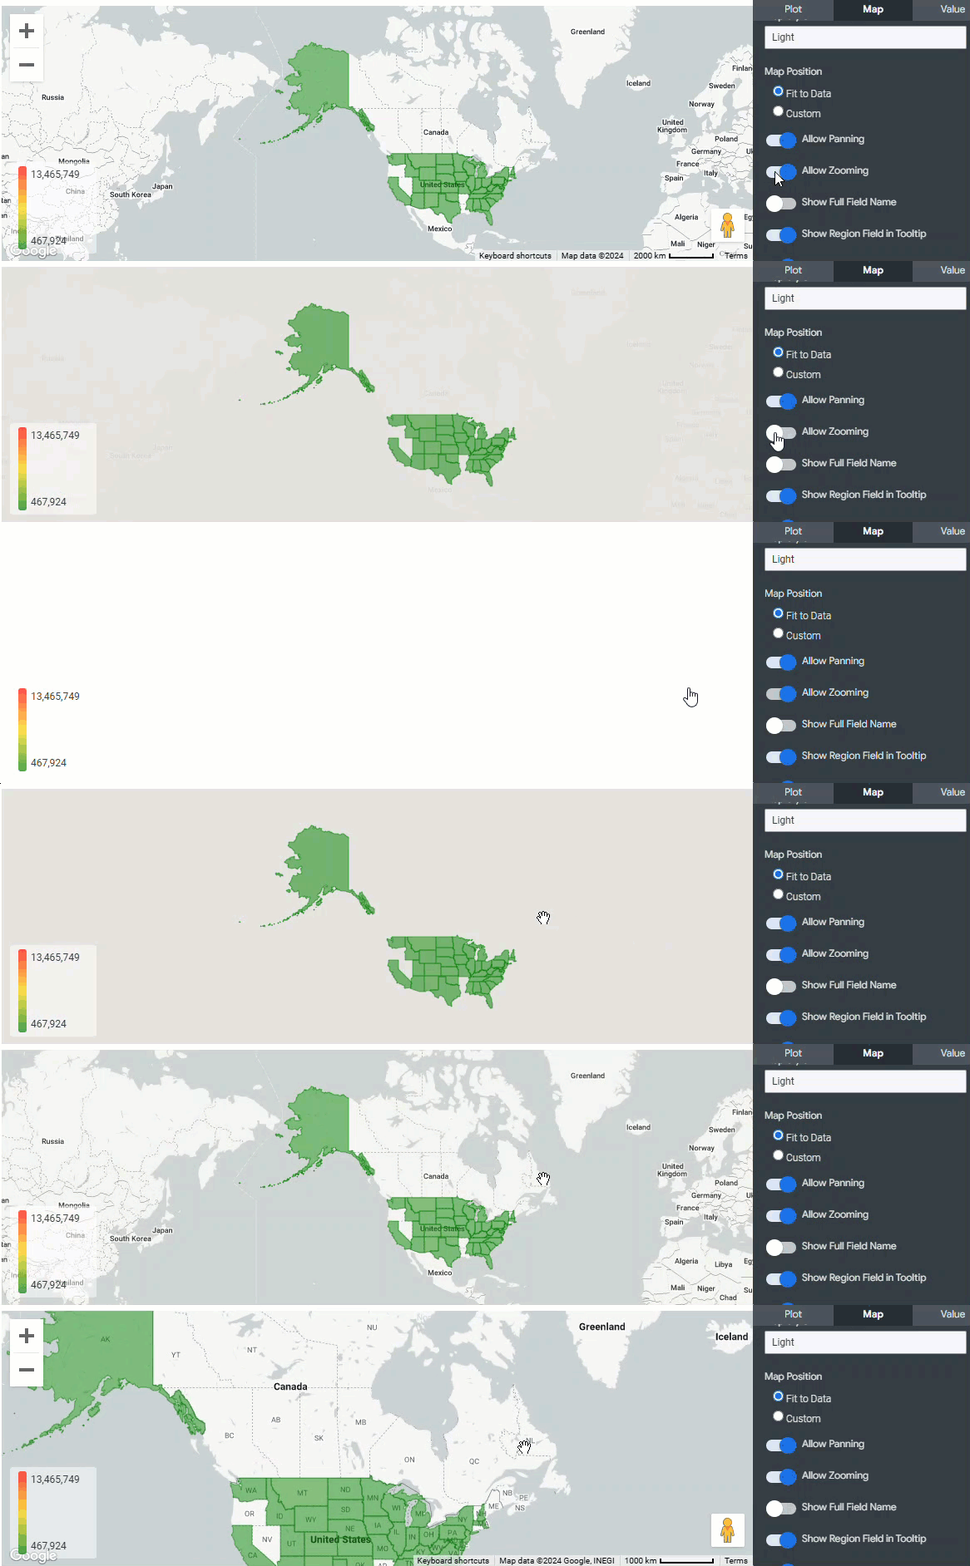
Determines whether to show the view name along with the field name, and the region information, in map tooltips.
- Show Full Field Name - Determine whether to show the view name along with the field name in map tooltips, which are displayed when users click on map data points.
- Show Region Field in Tooltip - Determine whether to display the region information in the tooltip of the map.
What else do you need help with?
Not what you're looking for? Navigate to Understanding the Insights Google Maps Visualization


