Through the Plot Menu, the Google Maps Visualization in an Insights Explore provides tools for visualizing and analyzing geospatial data. By leveraging these options, you can create more informative and visually appealing maps to support your data-driven decision-making.
The following instructions will guide you through accessing the plot menu and customizing the Google Map display.
Step 1: Access a report through an Insights Explore
Log in to the CyberGrants platform and navigate to the Insights tab.

In the left-hand menu, select the "Analyze" option to view and choose from the available Explores.
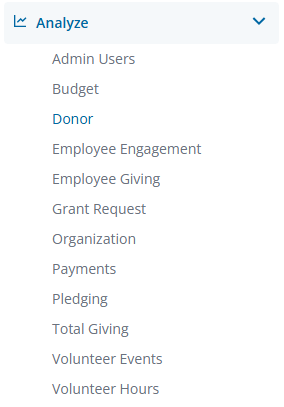
Create a new report by either building it from scratch by adding relevant fields or if any prebuilt Quick Start reports are available, select one of those as a starting point.
Step 2: View the Google Maps Visualization Plot Menu
Use the ellipsis in the Visualization toolbar to access the Google Maps Visualization type.

Click Edit in the right corner of the Visualization toolbar to access the Google Maps Visualization Plot Menu options.
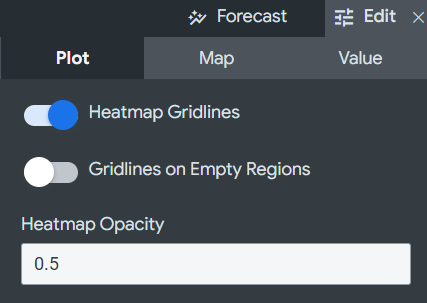
Step 3: Enable Heatmap Gridlines
Toggle on the "Heatmap Gridlines" option to add a border around each of the gridlines used for the heatmap.
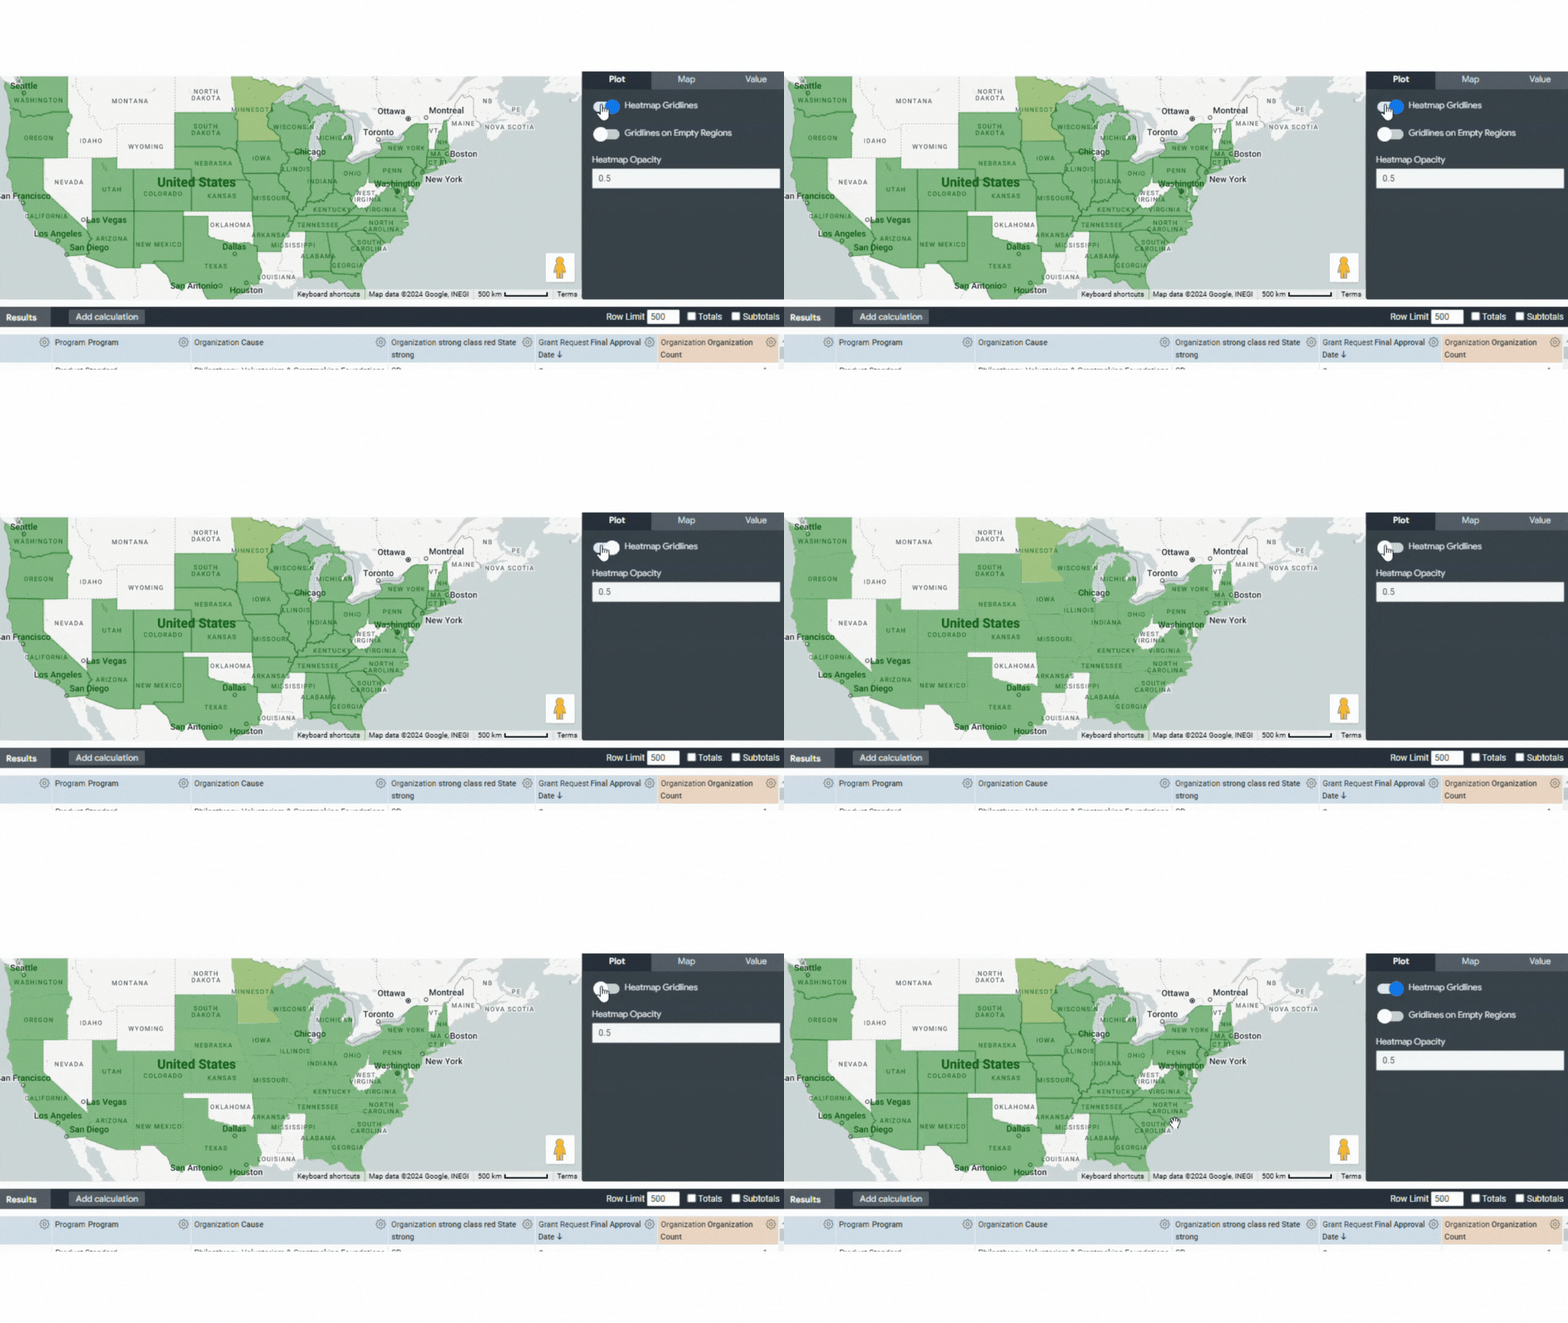
Step 4: Display Gridlines on Empty Regions
If the "Heatmap Gridlines" option is enabled, you can toggle on the "Gridlines on Empty Regions" option to display an outline around the map regions that have no associated data.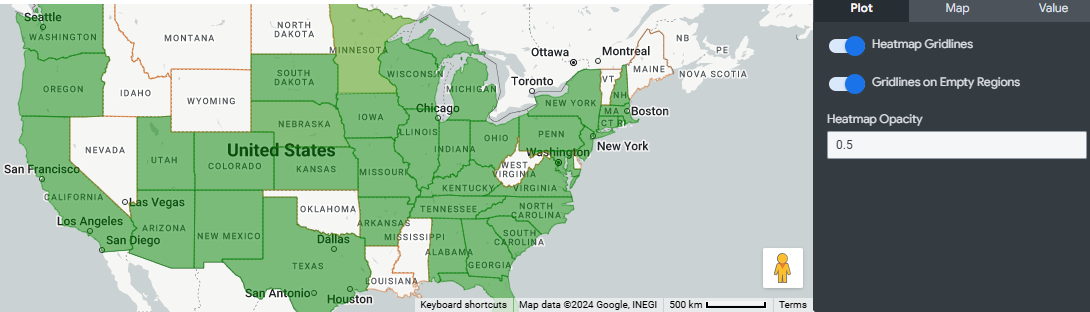
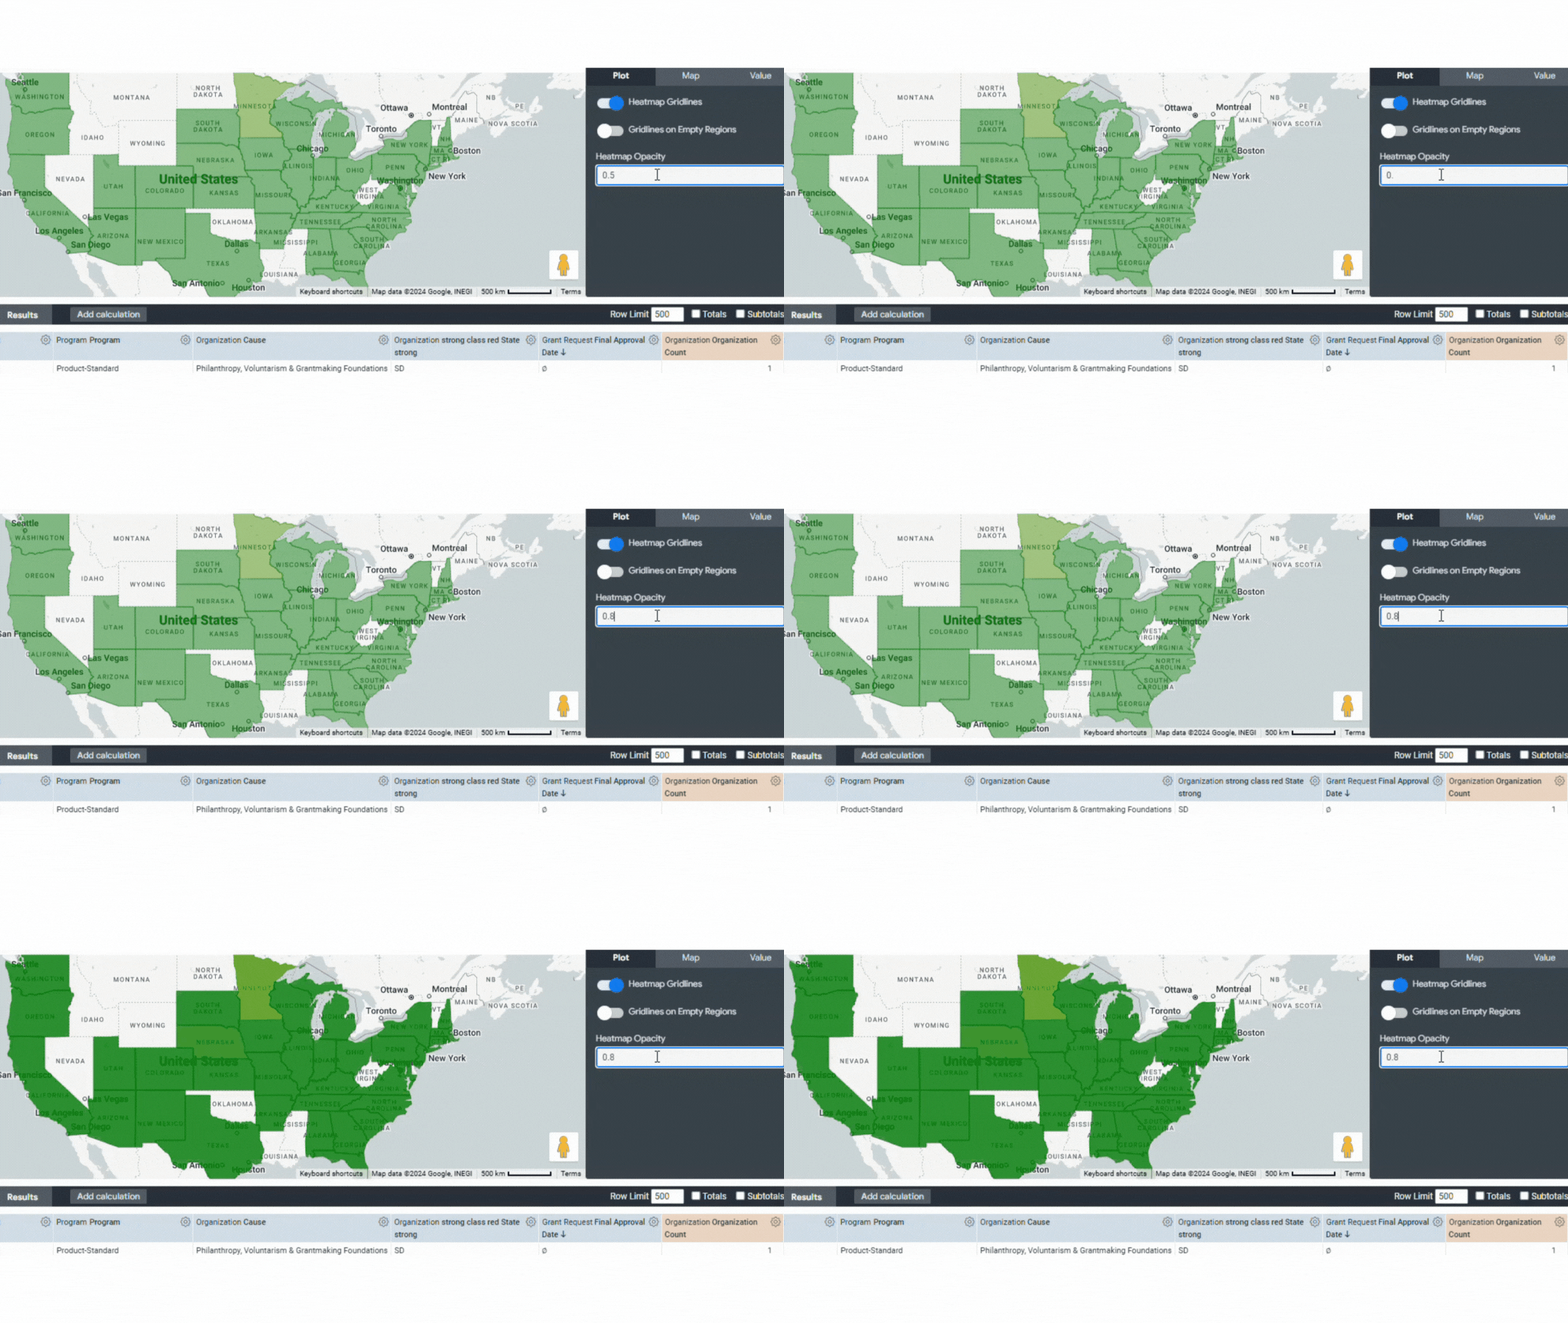
Step 5: Adjust Heatmap Opacity
Use the "Heatmap Opacity" setting to specify the opacity of the colors used in the heatmap. Enter a number between 0 and 1, where 0 means no color and 1 means totally opaque.
What else do you need help with?
Not what you're looking for? Navigate to Understanding the Insights Google Maps Visualization


