Through an Insights Explore, users can select the single value icon from the Visualization toolbar to view a report as a single value chart and leverage the Single Value Visualization to quickly highlight and communicate key program metrics or statistics. This visualization type allows users to prominently display a single data point, with options to customize the value formatting, add comparison information, and apply conditional formatting rules.
Proceed as follows to access the Single Value Visualization type within an Insights Explore.
Step 1: Access the Insights tab
Log in to the CyberGrants platform and navigate to the Insights tab.

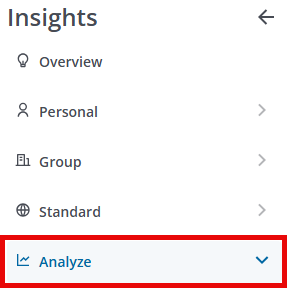
Step 2: Click on Analyze
From the left-hand menu, click on Analyze to view the available Explores.
Step 3: Choose an Explore
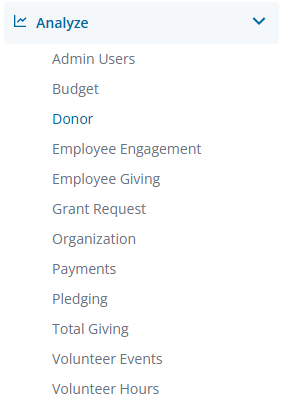
Select an Explore from the Analyze drop-down list.
Step 4: Build or Select a Report
Create a new report by either building it from scratch by adding relevant fields or if any prebuilt Quick Start reports are available, select one of those as a starting point.
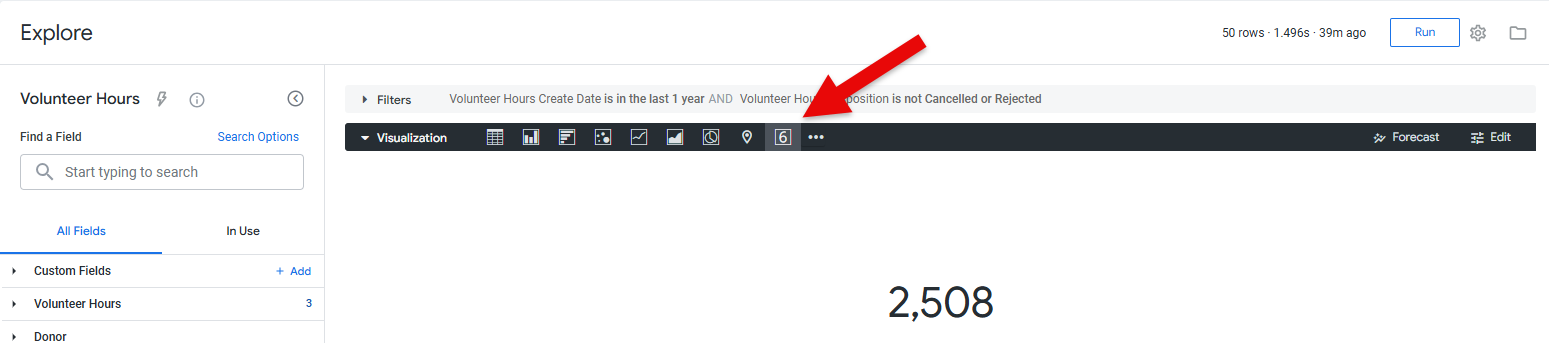
Step 5: Select the single-value Icon
The single value icon in the Visualization toolbar will allow you to view the report as a single value chart.
Step 6: Prioritize First Row Data
The single-value visualization always displays a value from the first row. In the Data section of the Explore, sort, and filter as needed so that the desired data is in the first row. Users can change which field is used by dragging fields to change their position or by hiding fields as needed. The visualization will prioritize by displaying values in the following order:
- The leftmost measure
- The leftmost table calculation is based on a measure
- The leftmost dimension

What else do you need help with?


