Insights users can leverage the Formatting Menu to enhance the appearance of a Single Value Visualization within an Explore. Through the formatting menu, users can effectively highlight important data points, draw attention to specific thresholds, and enhance the overall visual representation of their program data.
Proceed through the steps below to customize the Insights Single Value Visualization using the Formatting Menu options.
Step 1: Access Insights and choose an Explore
Log in to the CyberGrants platform and navigate to the Insights tab.

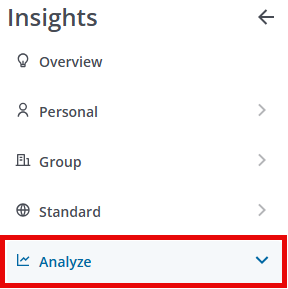
In the left-hand menu, select the "Analyze" option to view and choose from the available Explores.
Step 2: Build or select a report
Create a new report by either building it from scratch by adding relevant fields or if any prebuilt Quick Start reports are available, select one of those as a starting point.
Step 3: View the Single Value Visualization Formatting Menu
The single-value icon in the Visualization toolbar will allow you to view the report as a single numeric value.

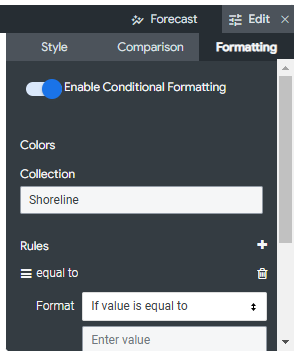
Navigate to the Formatting menu options in the Insights Single Value Visualization type.
Step 4: Enable Conditional Formatting
Within the Formatting Menu, toggle the "Enable Conditional Formatting" switch to the "On" position.
Step 5: Change the Color Theme
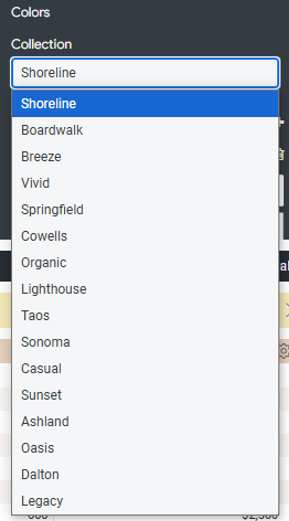
Utilize the Collection feature to update the themed visualization and achieve a cohesive appearance.
Step 6: Define Formatting Rules
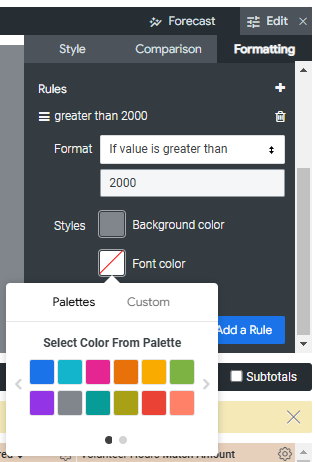
Under the "Rules" section, you can create one or more formatting rules. Each rule allows you to specify the conditions that will trigger the formatting changes. The available rule formats include:
- Equal to/Not equal to
- Greater than/Less than
- Between/Not between
Enter the numerical value(s) that will be used to apply the formatting. 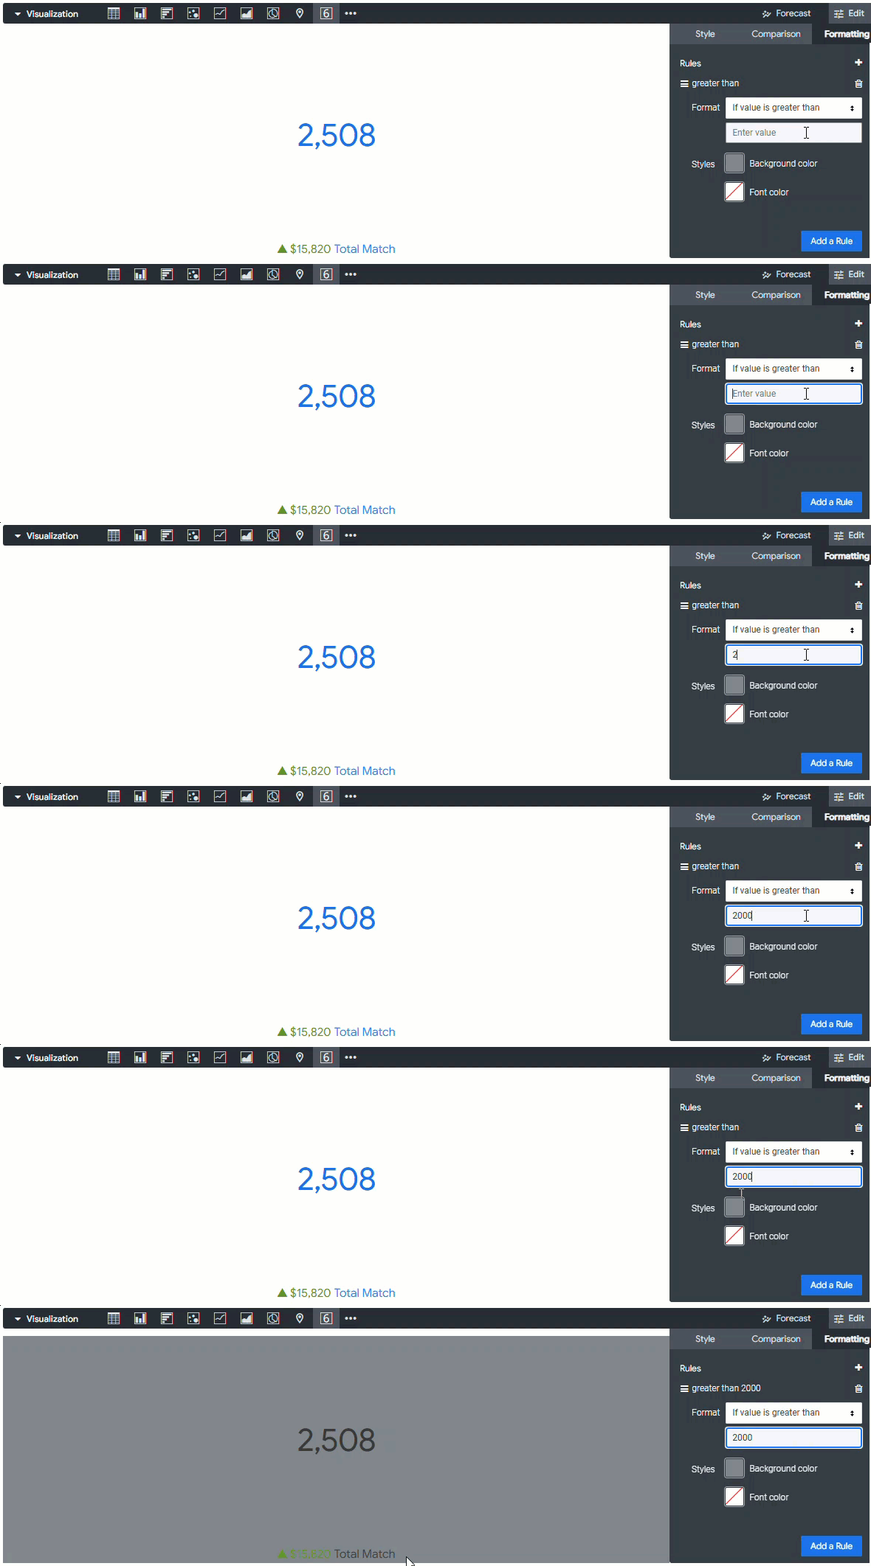
Step 7: Customize Formatting Styles
For each rule, you can define the desired formatting styles.
- Background color - Adjust the background color by choosing from the provided color palette or selecting a custom color.
- Font color - Modify the font color by choosing from the color palette or selecting a custom color.
Step 8: Add Additional Rules
If needed, you can add more rules to further refine the conditional formatting. Click the "Add Rule" button to create additional formatting conditions.
What else do you need help with?
Not what you're looking for? Navigate to Understanding the Insights Single Value Visualization


