Insights Single Value Visualization Overview
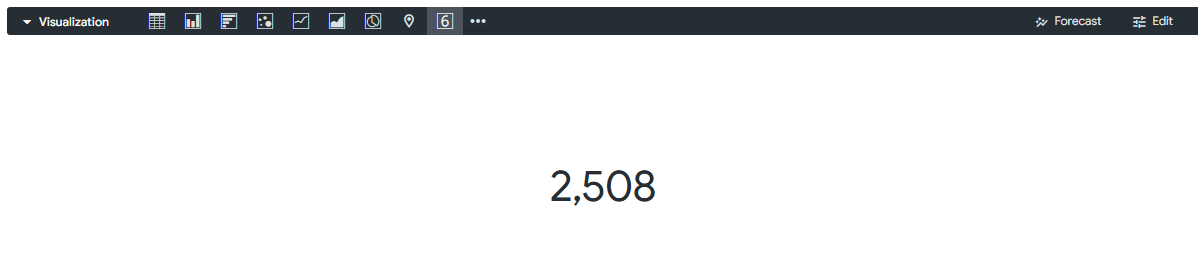
The Insights Single Value Visualization type allows users to display a single, prominent data point within an Explore. This visualization is useful for quickly highlighting a key metric or statistic, such as total hours, number of contributors, or average grant amount.
This feature includes a robust set of customization options allowing Insights users to tailor the display of data to their specific reporting needs. The Style menu provides control over the value color, title, and formatting, while the Comparison menu enables users to show a secondary field alongside the primary value, such as a percentage or change from a previous period. The Formatting menu further enhances the visualization by allowing conditional formatting rules to highlight important data points.
Feature Availability:
The Insights Visualization Types available within Insights Explores are accessible only to Insights Analysts. Administrators can manage Insights permissions for their program's internal users through the Users section in the Insights platform. Click Here to learn more about the Insights Self-Service User Management Portal.
Please view the articles below to learn more about the Insights Single Value Visualization.
What do you need help with?
What else do you need help with?
Not what you're looking for? Navigate to Insights Visualization Types Overview


