Insights Visualization Types Overview
Insights offers a wide range of visualization options that allow Insights Analysts to effectively make sense of their program's data through an Explore's data set. Each type of visualization has various settings that can be customized to further enhance its appearance and functionality. For example:
- Table charts allow users to freeze columns, sort data, and customize the appearance of column headers and cell values.
- Column and Bar charts offer options to adjust series positioning, grid layout, and axis scaling.
- Line charts provide controls for line interpolation and the handling of null values.
- Pie charts enable users to customize label formatting and the overall chart appearance.
- Map visualizations allow users to select different base map styles and control the map positioning and zoom level.
- Single Value, Liquid Fill Gauge, and Radial Gauge visualizations offer a range of style, value, and comparison options to best represent the data.
Across all visualization types, Insights Analysts can leverage features like conditional formatting, reference lines, and trend lines to further analyze and present their program data.
Feature Availability:
The Insights Visualization Types available within Insights Explores are accessible only to Insights Analysts. Administrators can manage Insights permissions for their program's internal users through the Users section in the Insights platform. Click Here to learn more about the Insights Self-Service User Management Portal.
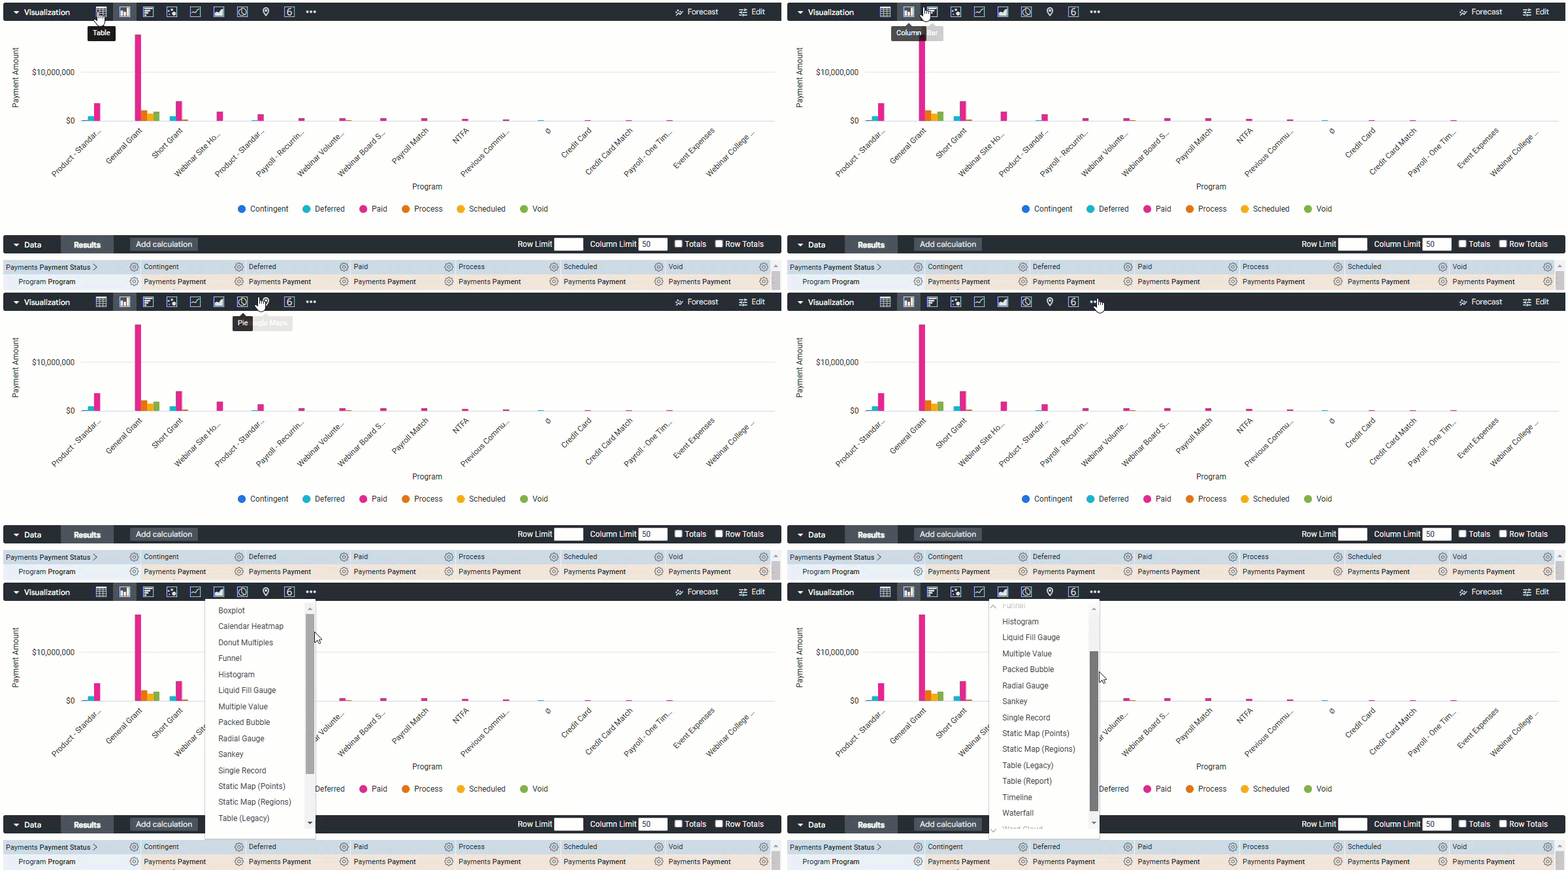
The following articles describe the visualization types we identified as most commonly used along with each type's configuration options.
What do you need help with?
Understanding the Insights Table Visualization
Understanding the Insights Column Visualization
Understanding the Insights Bar Visualization
Understanding the Insights Line Visualization
Understanding the Insights Pie Visualization
Understanding the Insights Google Maps Visualization
Understanding the Insights Single Value Visualization
Understanding the Insights Liquid Fill Gauge Visualization
Understanding the Insights Radial Gauge Visualization
Additional Resources
To view further details on all visualization types available, please reference Looker's Full Documentation on Visualization Types.


