The Data Portlets within the CyberGrants Dashboard tab empower program administrators to gain valuable insights, identify trends, and make informed decisions based on the visual representation of relevant information, enabling internal users to explore data, identify patterns, and uncover meaningful insights to drive program success.
To learn more about the capabilities of the Data Portlets available in the Dashboard tab, please review the following details.
Step 1: Access the Dashboard tab
Log in to the CyberGrants platform and navigate to the Dashboard tab.

Step 2: Locate the Data Portlets
Identify the various Data Portlets available on your Dashboard, which may include:
- Maps
- Charts
- CyberGrants Operational Metrics
Step 3: Utilize the Maps Portlet
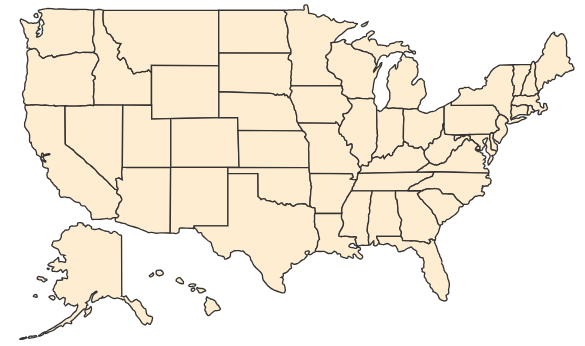
This portlet presents a comprehensive, full-scale representation of the United States, individual regions, and global perspectives in a visually engaging map format. This feature enables users to explore and analyze data within a geospatial context, providing valuable insights through the spatial visualization of information. By leveraging this portlet, program administrators can uncover location-based trends, identify patterns, and make data-driven decisions to optimize program strategies and impact.
(i.e.) Full United States map:
Step 4: Explore the Charts Portlet
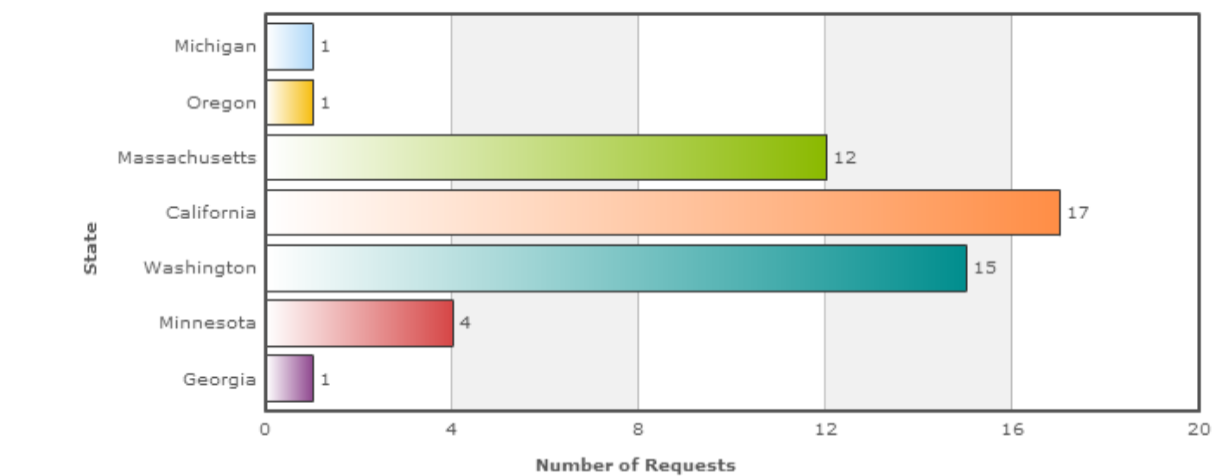
This portlet displays data in a variety of easily interpretable chart formats, including bar, column, line, and pie charts. Users can utilize these dynamic visualizations to analyze information in a clear and impactful manner, supporting data-driven decision-making.
(i.e.) Bar Chart:
Step 5: Access the CyberGrants Operational Metrics Portlet
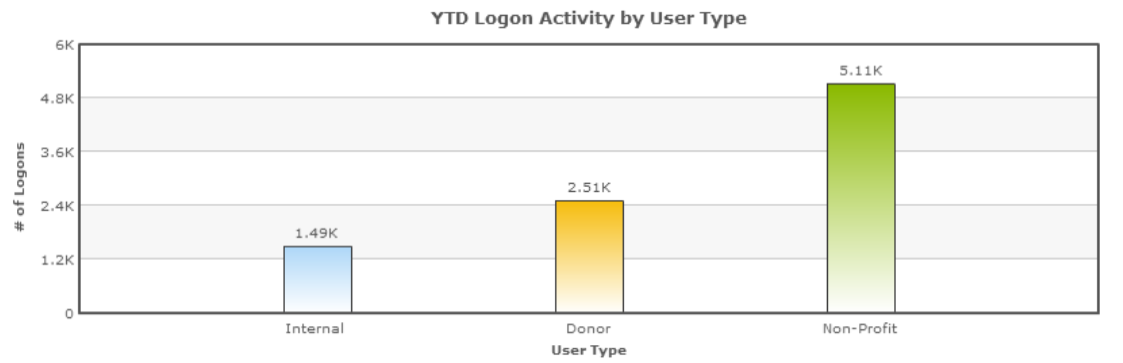
This portlet displays a comprehensive suite of CyberGrants operational metrics, providing program administrators with a consolidated view of key performance indicators. Users can leverage this feature to support data-driven decision-making and optimize program efficiency by monitoring critical operational data points.
(i.e.) YTD Logon Activity:
What else do you need help with?
Not what you're looking for? Navigate to Understanding the Dashboard Tab


