Insights Table Calculations Overview
The Insights Explore (Looker) table calculations provide Analysts with a powerful and flexible way to create on-the-fly metrics and analyses of their program's data using formulas similar to those found in spreadsheet tools, such as Excel.
- These calculations can evaluate to numbers, dates, text, or boolean values, giving Analysts the ability to perform complex transformations and computations by building a wide range of custom metrics tailored to their specific reporting needs.
- When viewing an Insights data table with Table Calculations, the calculations appear as green columns, rather than as blue columns (dimensions) or orange columns (measures).
The following articles give instructions on the process of creating table calculations, including how to calculate metrics like percent of previous and percent change. You will also find a comprehensive list of the available functions that can be used within table calculation expressions.
Feature Availability:
Insights Explores are accessible only to Insights Analysts. Administrators can manage Insights permissions for their program's internal users through the Users section in the Insights platform. Click Here to learn more about the Insights Self-Service User Management Portal.
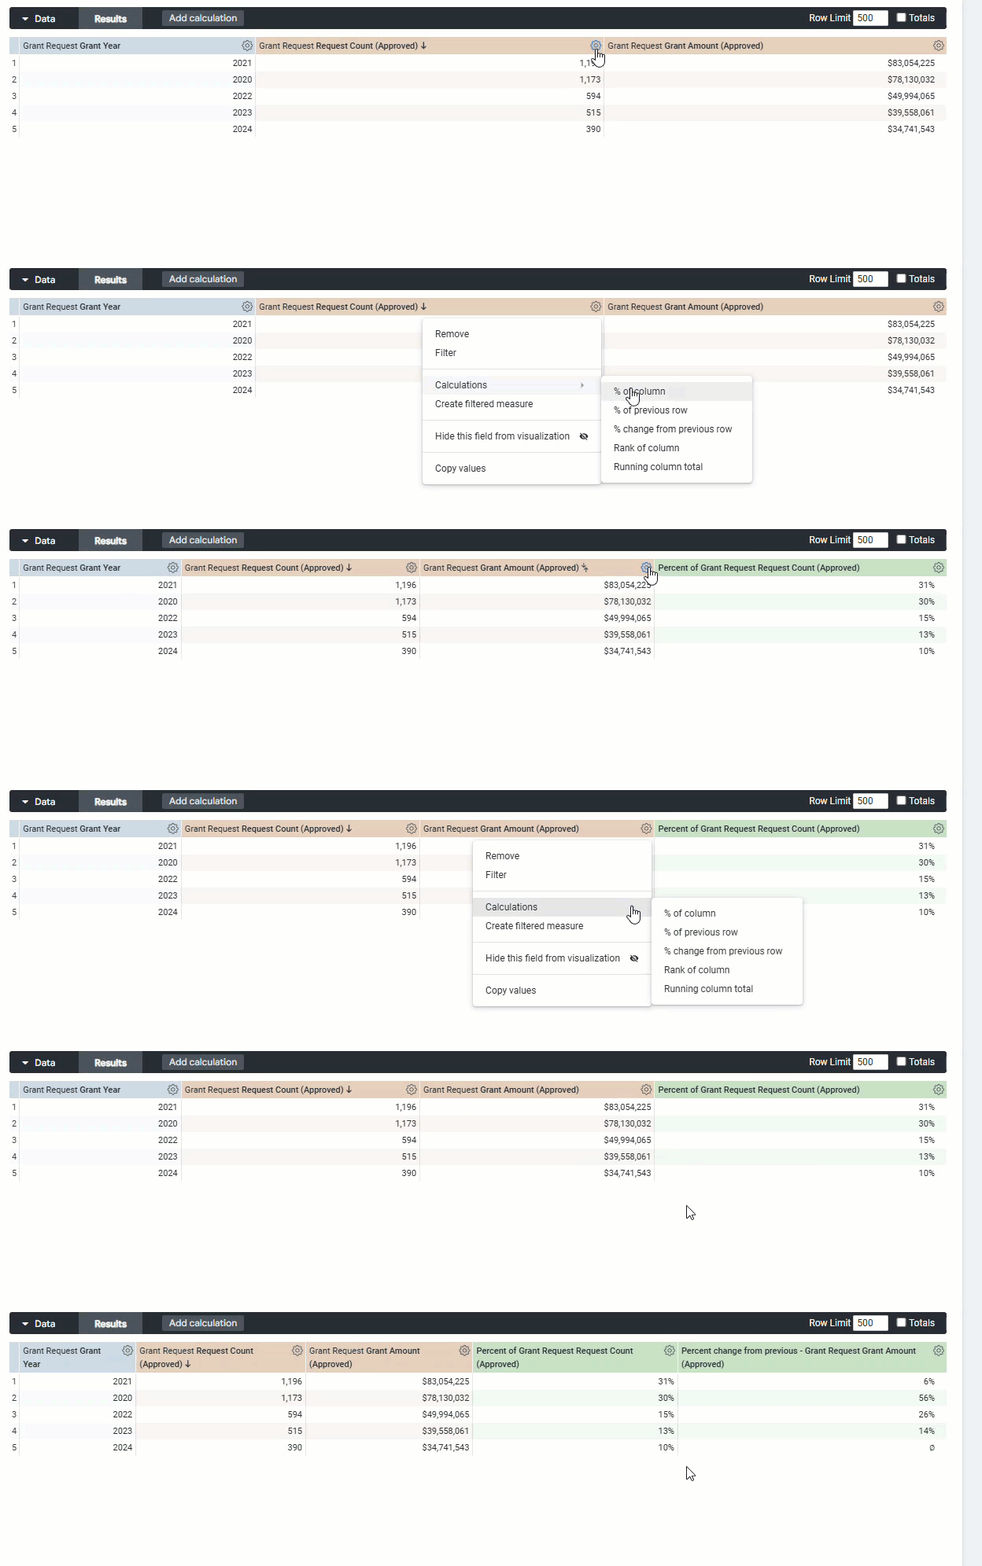
Proceed as follows to learn how to leverage table calculations in an Insights Explore.
What do you need help with?
Not what you're looking for? Navigate to Insights Analyze Advanced Overview


