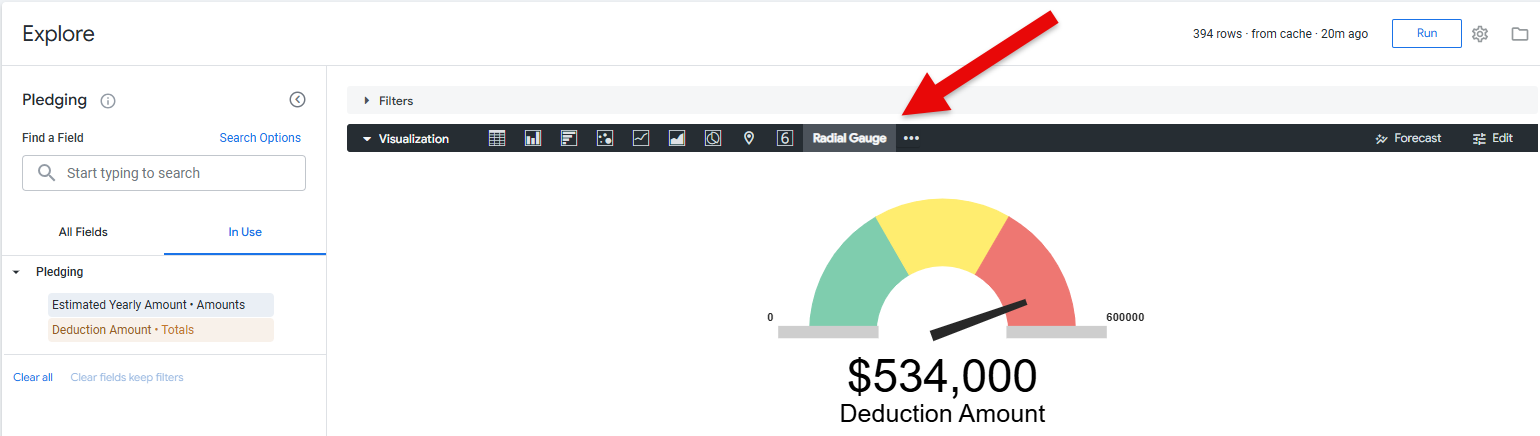
Insights users can access the Radial Gauge Visualization type through an Insights Explore to view a report as a radial graph. This visualization type enables users to easily visualize their actual values compared to the progress toward another projected value or goal, providing a clear and intuitive way to track and monitor performance.
Proceed as follows to access the Radial Gauge Visualization type within an Insights Explore.
Step 1: Access the Insights tab
Log in to the CyberGrants platform and navigate to the Insights tab.

Step 2: Click on Analyze
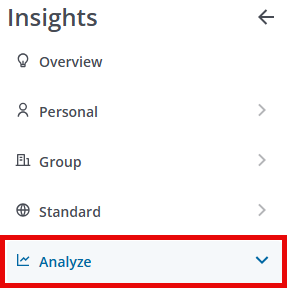
From the left-hand menu, click on Analyze to view the available Explores.
Step 3: Choose an Explore
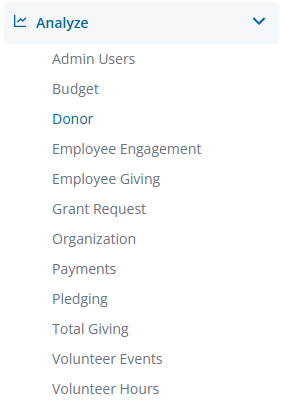
Select an Explore from the Analyze drop-down list.
Step 4: Build or Select a Report
Create a new report by either building it from scratch by adding relevant fields or if any prebuilt Quick Start reports are available, select one of those as a starting point.
Step 5: Select Radial Gauge
Choose Radial Gauge from the chart types available in the Visualization toolbar to view the report as a radial graph.
What else do you need help with?


