Insights Radial Gauge Visualization Overview
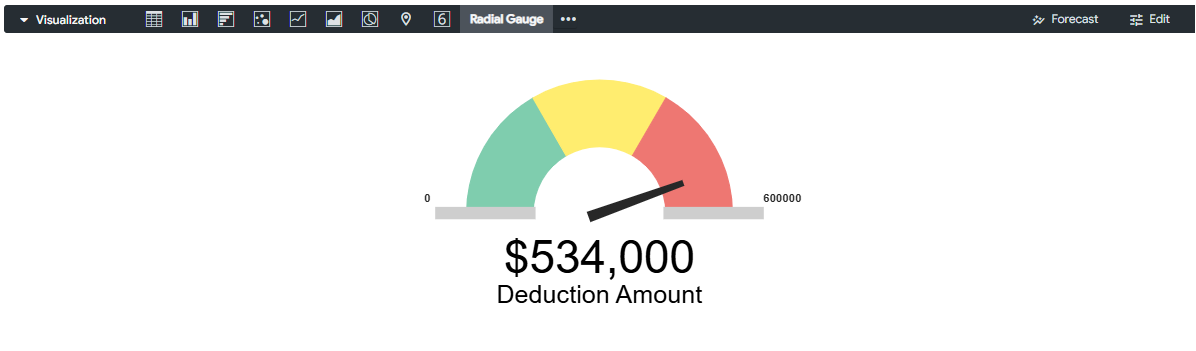
The Radial Gauge Visualization in Insights allows users to visually represent actual values compared to a projected value or goal. This type of visualization can be useful for quickly understanding performance against a target or benchmark.
Insights users can access and use this visualization by selecting the Radial Gauge Visualization from the available chart types within an Insights Explore. The Radial Gauge Visualization offers a range of customization options, including the ability to adjust the gauge fill type, color, target source, and value representation. Users can select from various settings to tailor the visual appearance of the gauge and ensure it effectively communicates the program data.
Feature Availability:
The Insights Visualization Types available within Insights Explores are accessible only to Insights Analysts. Administrators can manage Insights permissions for their program's internal users through the Users section in the Insights platform. Click Here to learn more about the Insights Self-Service User Management Portal.
To learn more about leveraging the Insights Radial Gauge Visualization type to track and monitor performance against program goals or targets, proceed with viewing the articles below.
What do you need help with?
What else do you need help with?
Not what you're looking for? Navigate to Insights Visualization Types Overview


