Each of the visualization tiles displayed on a dashboard are essentially separate standalone reports that can be drilled into and explored further as needed. Drilling into the data behind Insights Dashboard visualizations is a powerful way to gain a deeper understanding of your program's metrics by exploring the underlying data in more detail.
- It's important to note that all data within Insights is near real-time, updating every 2 hours. This means that the information you see in your dashboards is always current and up-to-date, ensuring that you have the most accurate and reliable data at your fingertips.
By following the steps below, you can effectively analyze the underlying data by accessing detailed records and navigating to specific views within the CyberGrants UI.
Step 1: Verify User Permissions
Before you can begin drilling into your dashboard visualizations, it's important to understand that only licensed Insights Analyst users have the ability to do so.
- If you are not an Analyst user, you will not be able to access the "Explore from here" functionality or the detailed data behind the visualizations.
Step 2: Access the Underlying Data
The data in each tile within a dashboard can be explored in 3 different ways:
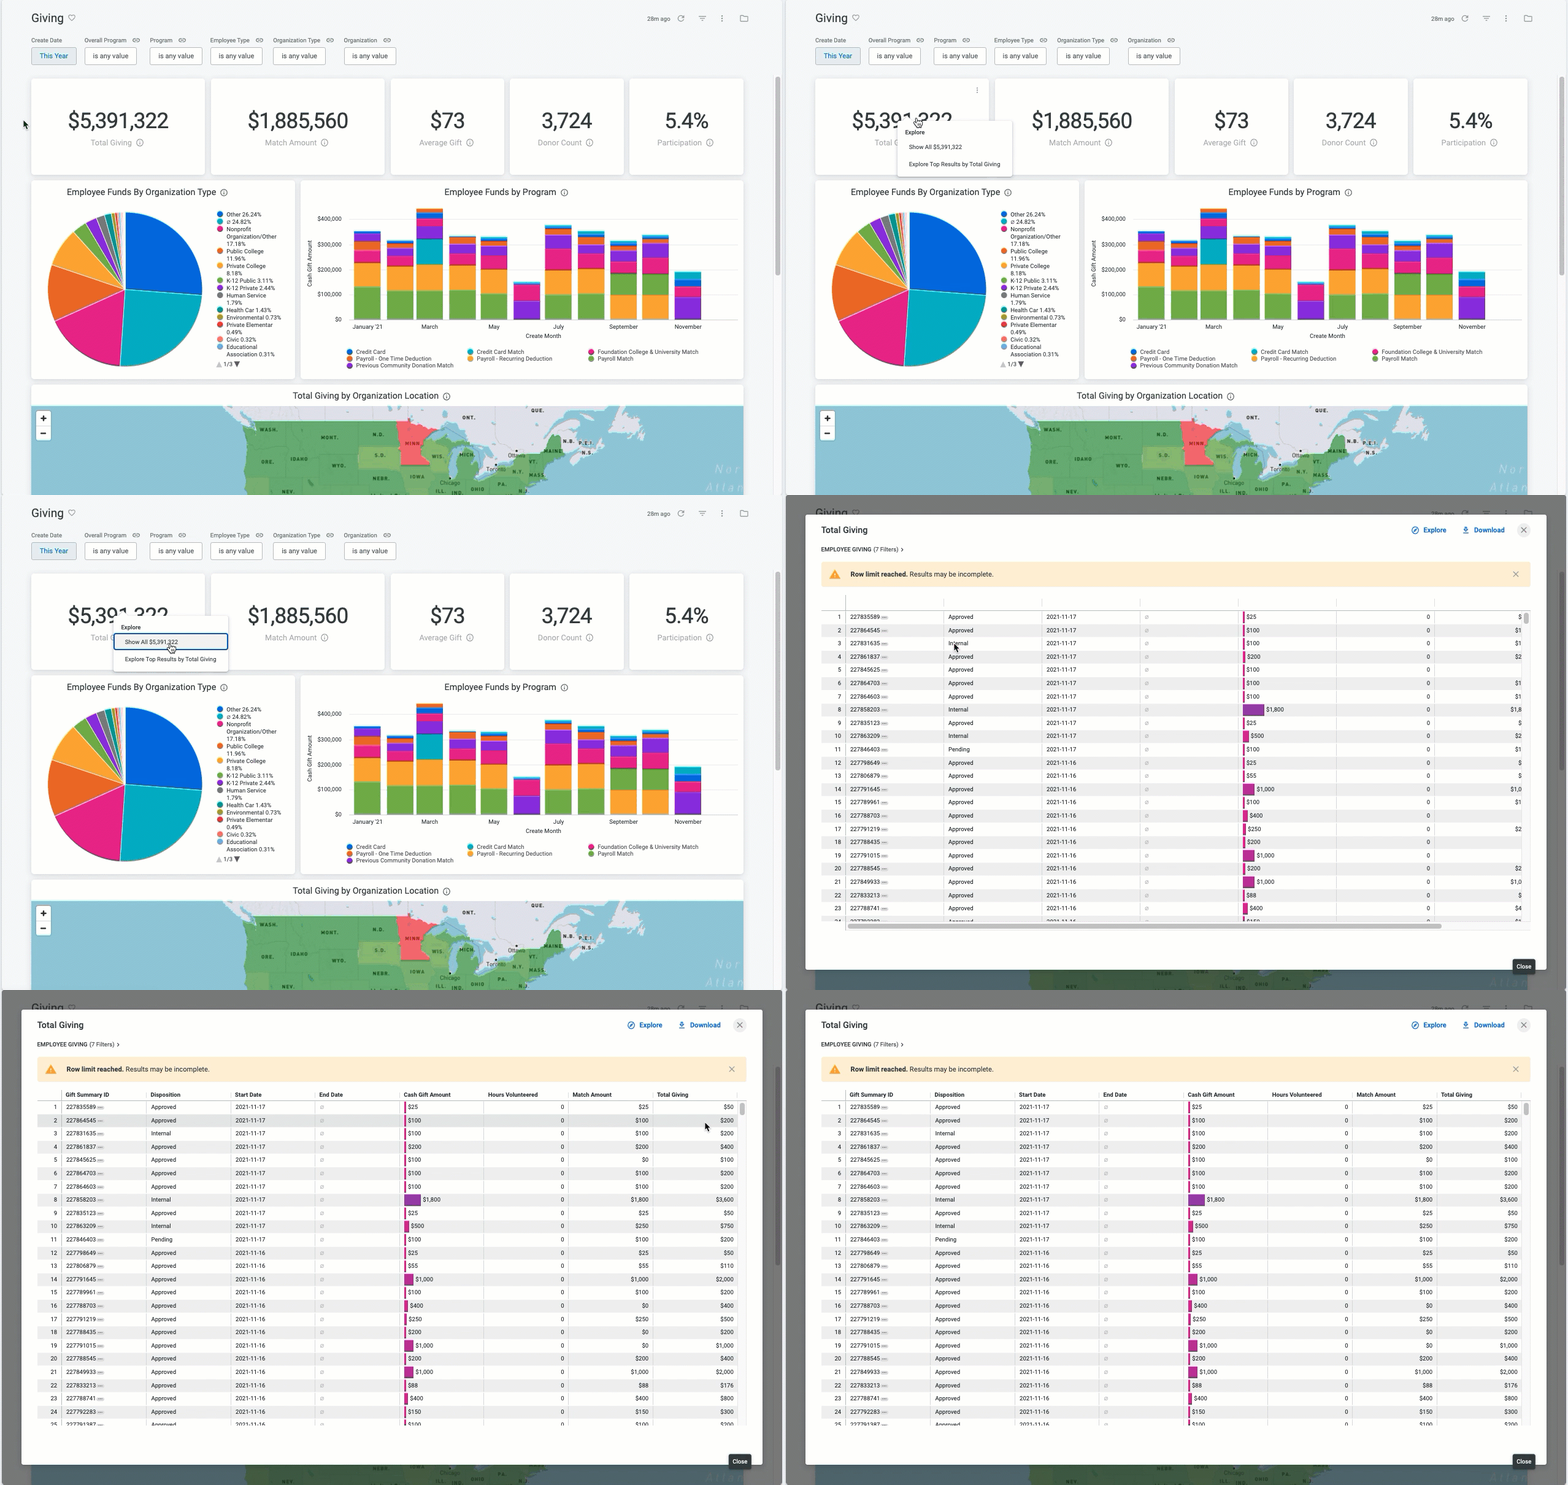
Right-click on a Tile
By right-clicking on a specific tile, you will see the option to “Show All ___”. Clicking this should populate an overlay itemized report containing all of the records that contribute to this tile. From here, the data can be downloaded or explored further as needed.
Use the Vertical Ellipses Menu
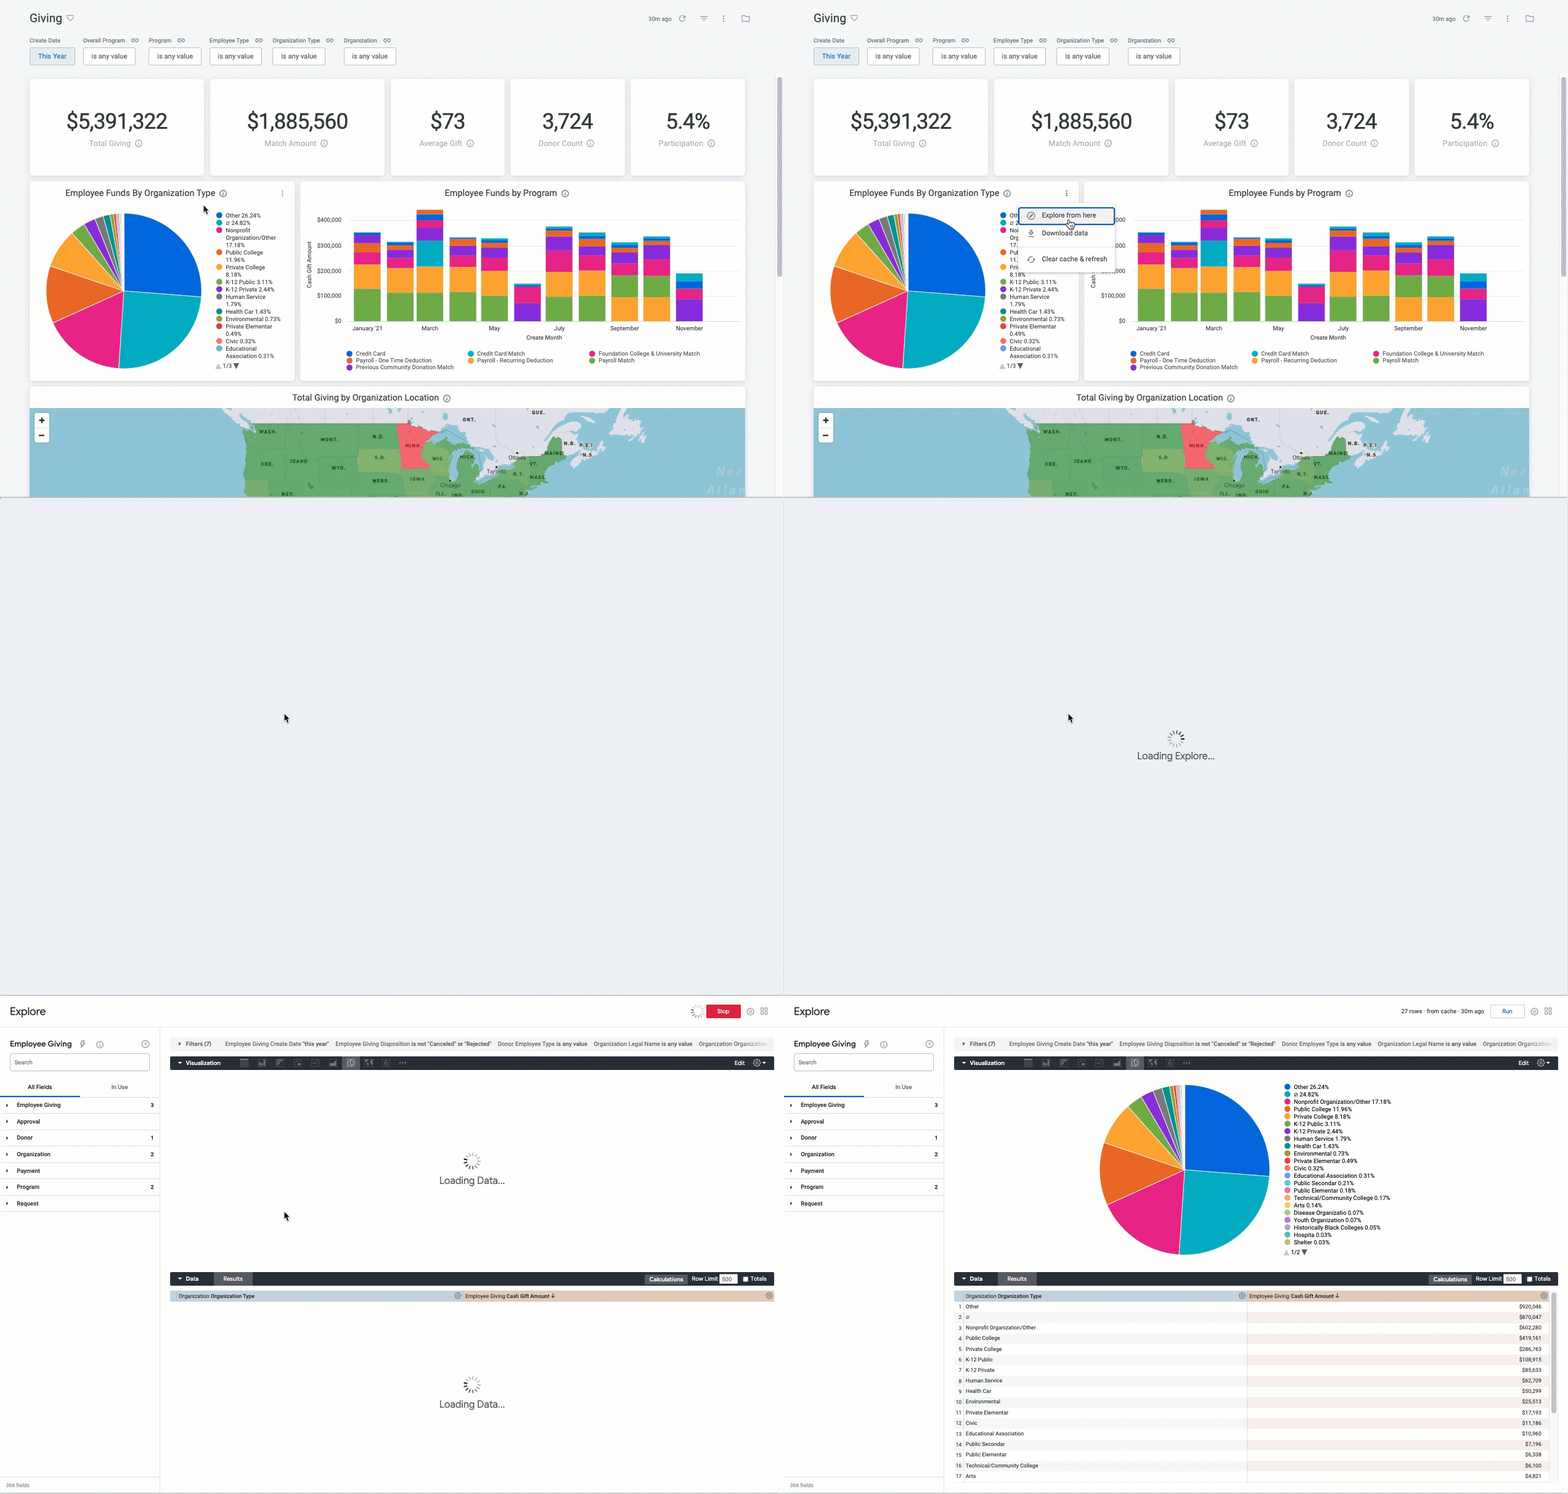
By clicking the vertical ellipses menu for each tile, you will see an option to “Explore from here”. Clicking this will take you to the underlying data fields that are driving this tile visualization, where you can add additional fields and explore, save, and share this data as needed.
-
- If you choose to “Explore from here” from a Standard dashboard, please note that this Explore will not contain any of your custom fields. To access your custom fields, you must do so via an “Analyze” Explore.
Use a Deep Link within a Table Visualization
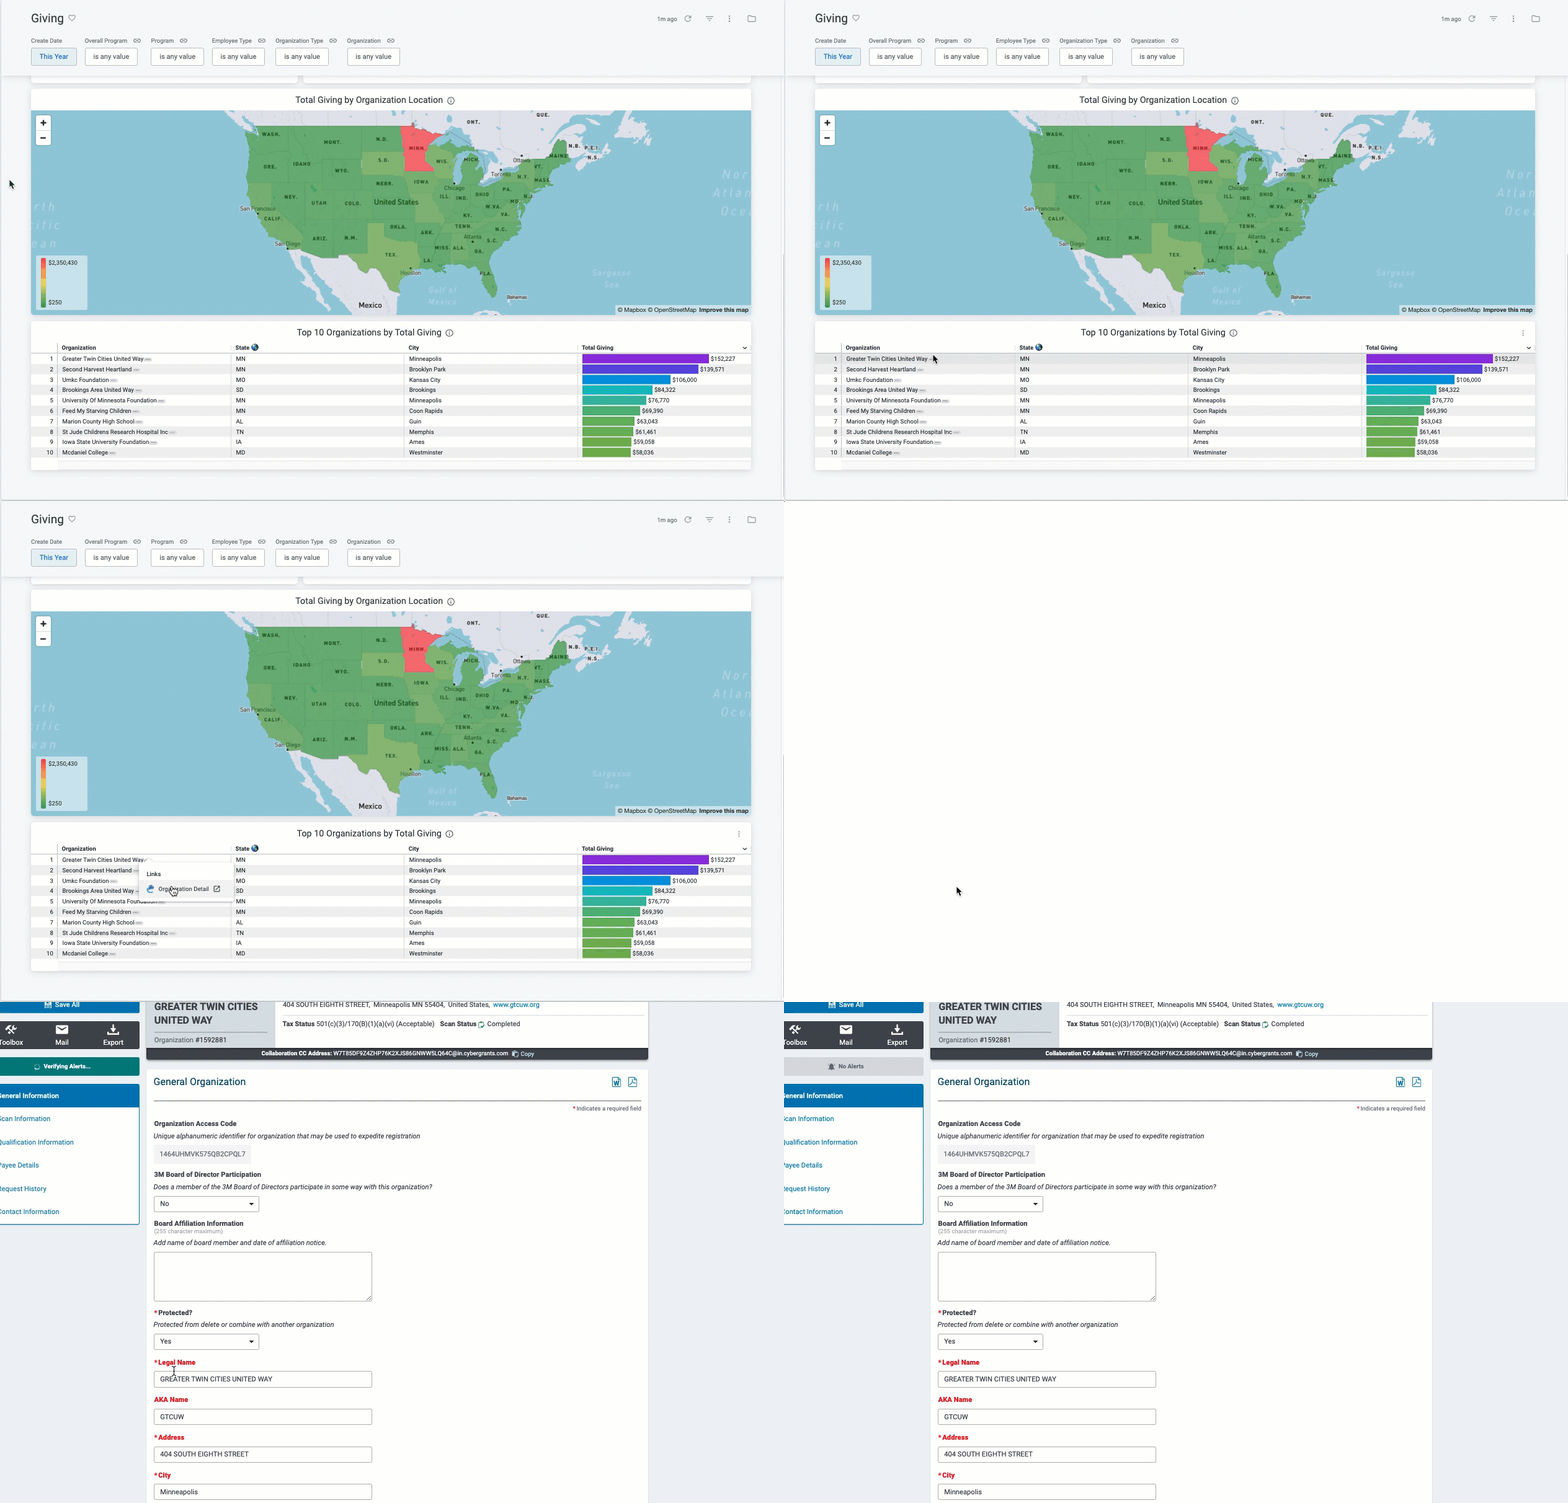
- In table visualizations, the presence of a deep link is indicated by a horizontal ellipsis (three dots) following the data in a field. This can take you directly to the detail for that value (i.e. Organization Detail or EG Request Detail) within the CyberGrants UI.
What else do you need help with?
Not what you're looking for? Navigate to Understanding Insights Dashboard Filtering and Navigation


