Insights Dashboard Filtering and Navigation Overview
A Dashboard is a collection of saved Reports (also known as “Looks”) that have been arranged on the page in a set of visualization tiles. Each tile can contain different supporting data elements, can be represented as different types of visualizations, and can be explored further as needed. Tiles can also contain helpful descriptions, which can be accessed by hovering over the info symbol.
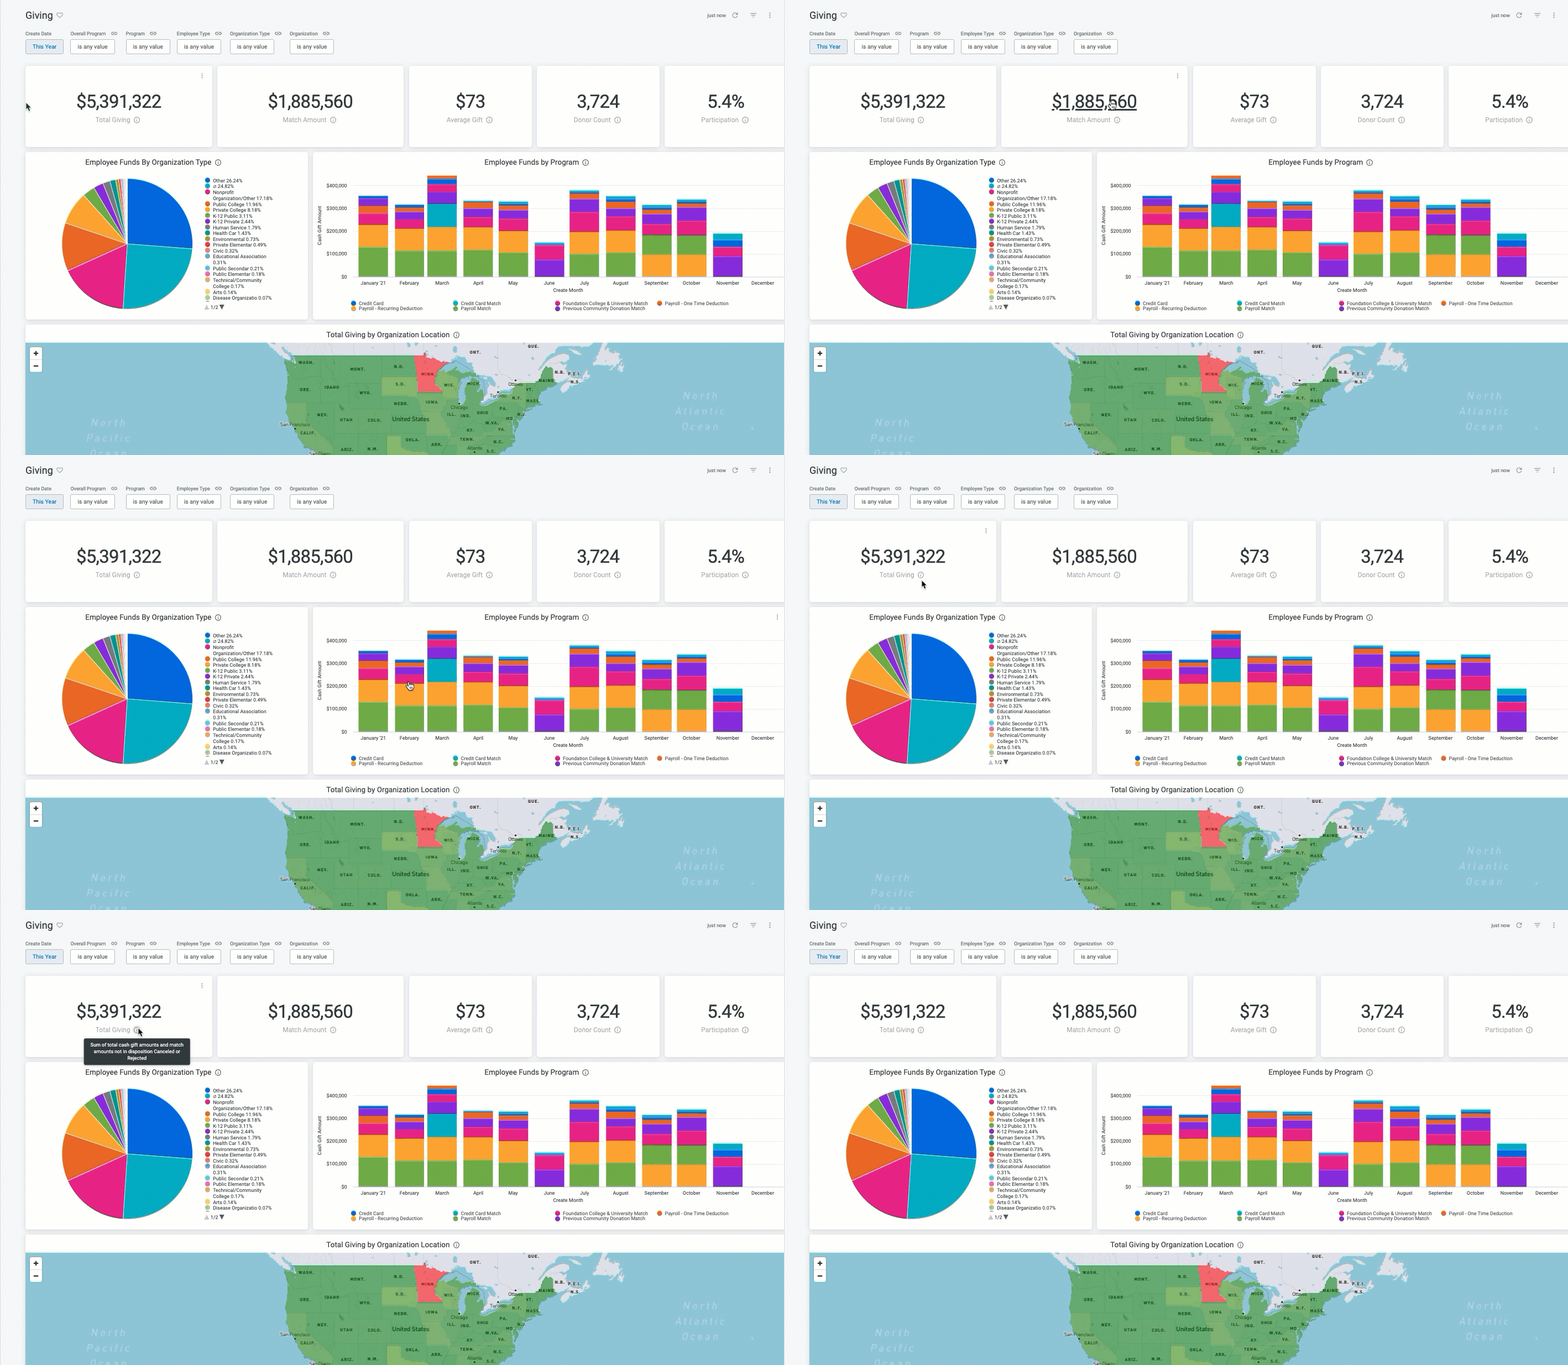
The following articles contain information about how you can navigate, filter, explore, and share the content that is presented on a standard or custom dashboard.
What do you need help with?
Additional Resources
Not what you're looking for? Navigate to Insights Dashboards Navigation Overview


