Insights Dashboards provide a powerful tool for visualizing and exploring data allowing users to, effectively, leverage available filters to unlock the full potential of their program's metrics.
The following steps will equip you with the knowledge to confidently navigate and analyze your data using the robust filtering capabilities of Insights Dashboards.
Step 1: Understand the Filter Options
At the top of any dashboard, you will see a set of available filters that can be leveraged to adjust how the data is represented.
- Standard dashboards will come with a set of predetermined filter categories that can be utilized, however new filter categories cannot be added.
- New filters can only be added to custom dashboards, created by any licensed Insights Analyst user within your organization.
Step 2: Change Filter Values
All users (Viewers and Analysts) can temporarily change the dashboard filter values to see how the data changes. To do this, simply click on the different options or selections shown in the filter. Keep in mind that these filter changes are not saved and will not affect other users' views of the same dashboard.
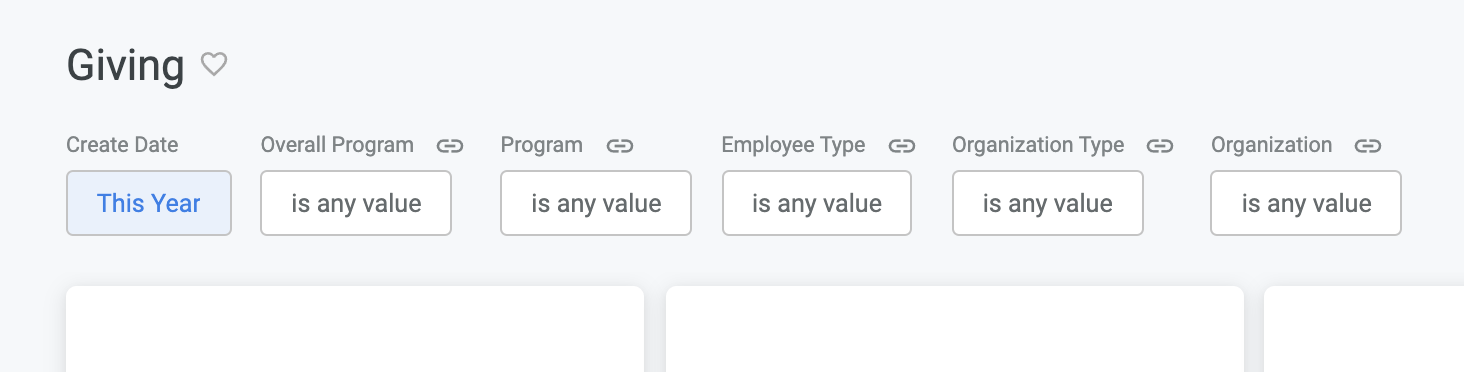
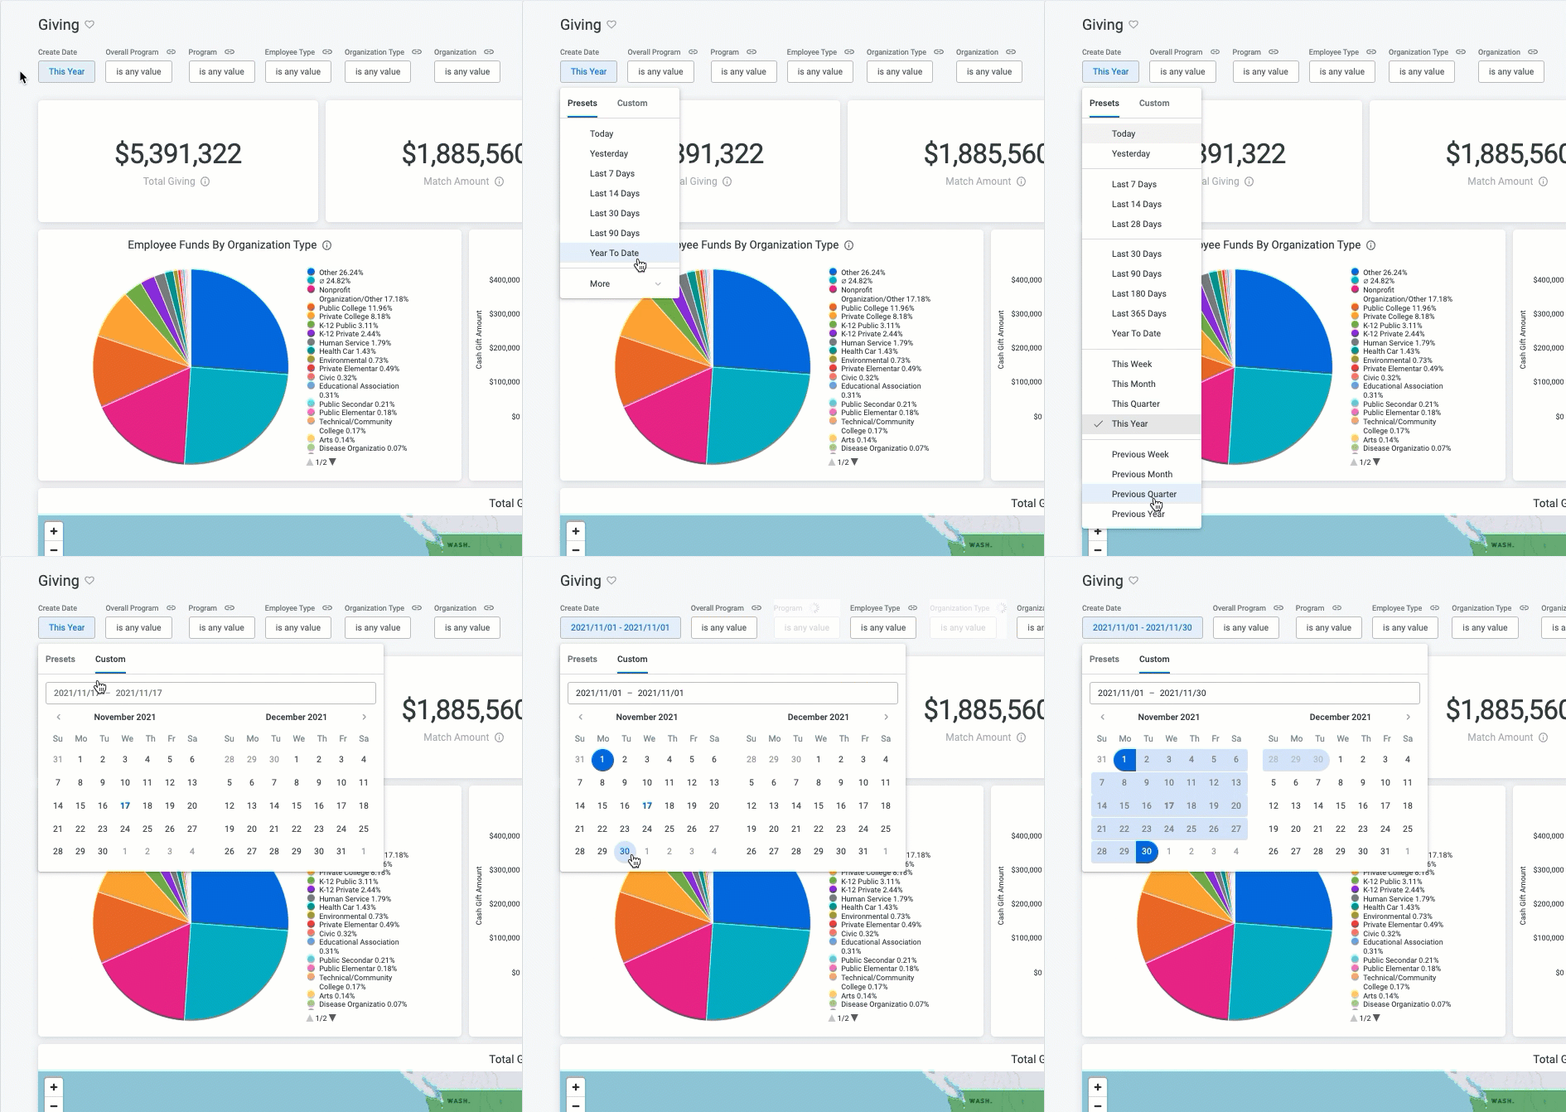
- For example, all standard dashboards should have a filter that specifies a timeframe to include a date (typically defaulted to "Year to Date"). If you would like to see a different timeframe, click on Year to Date to display a drop-down menu of preset range options. You can click 'More' to see even more options. If you select the Custom tab, you can set a custom date range of your choosing.
- To select one or more values from a filter, simply click the filter and either begin typing or select from the dropdown of options.
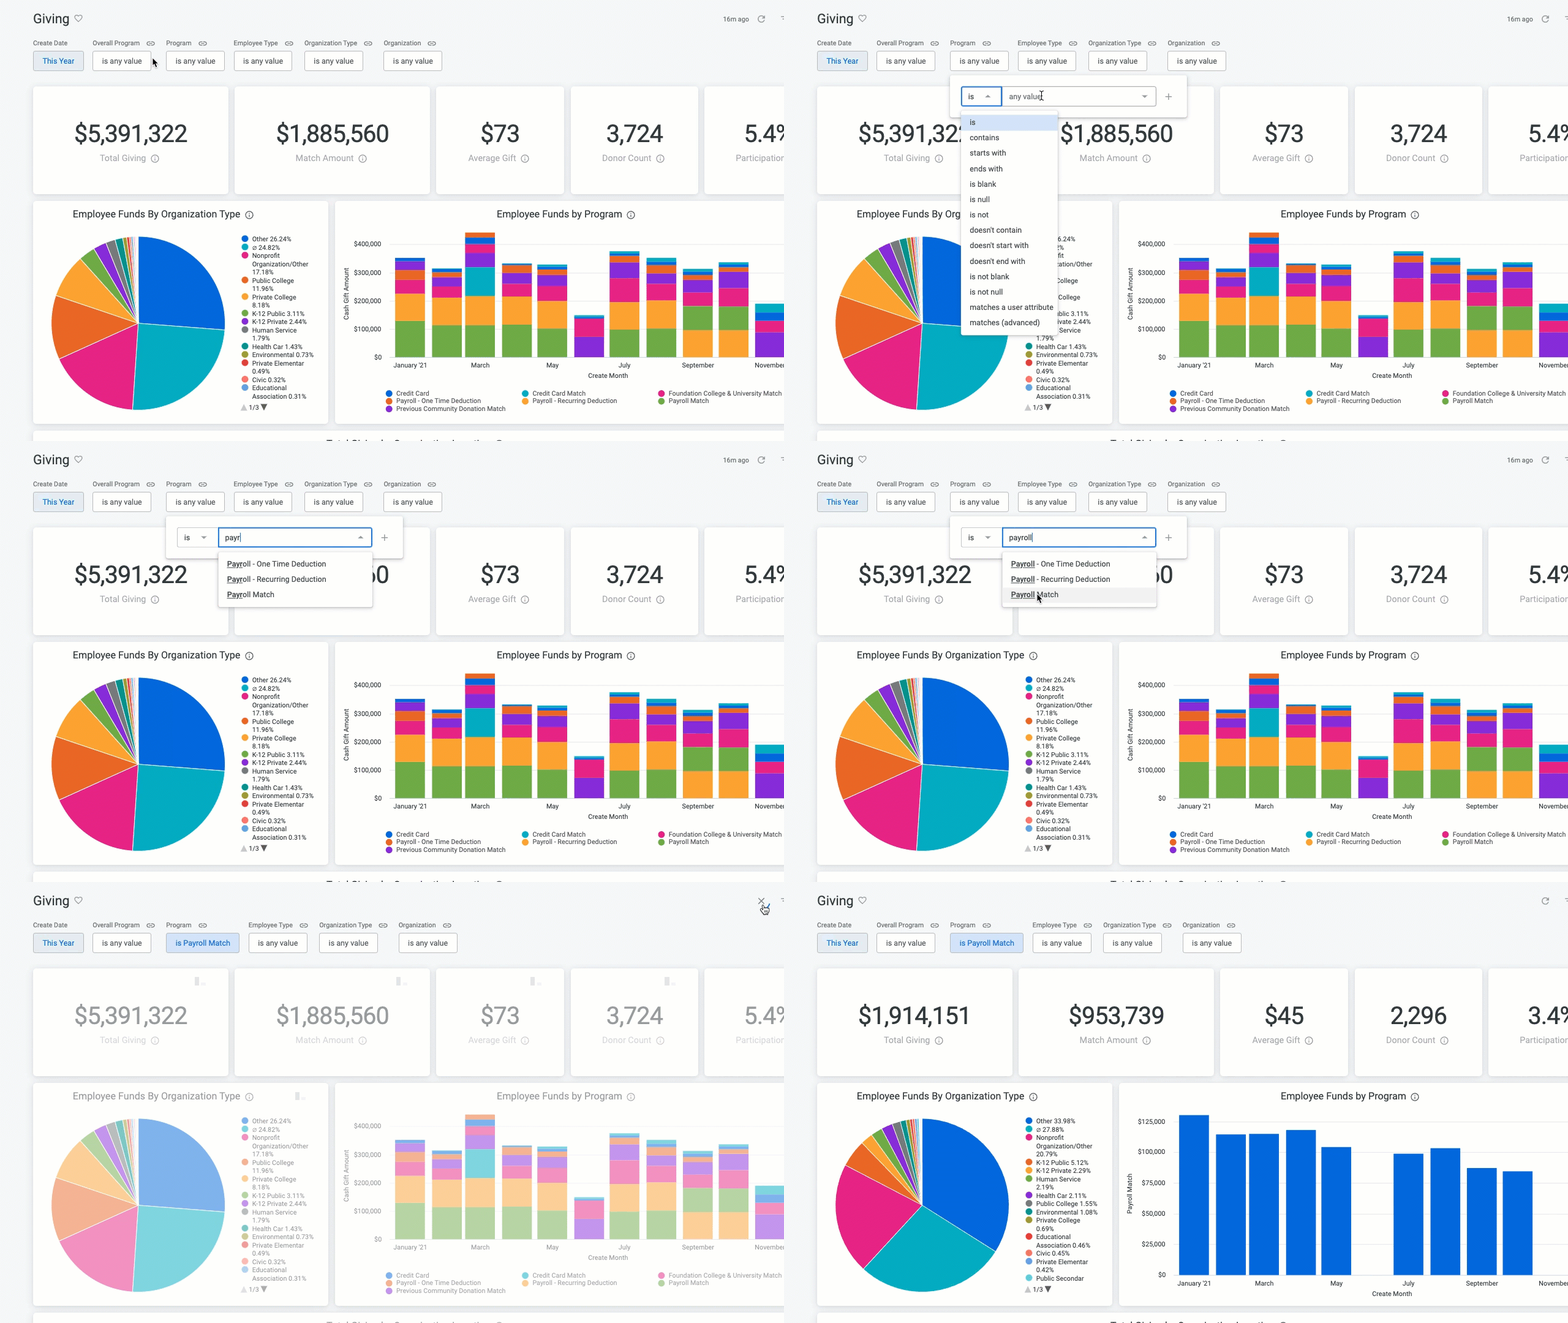
Once you have edited the filter as you like, click the update icon/button in the top right to see how the filter value changes will affect your data.
Step 3: Leverage Filter Operators
In addition to selecting specific filter values, you can also utilize a set of filter operators to refine your search. Familiarize yourself with these operators to get the most out of your data exploration.
Filter Operator
|
Description
|
| Is | Search of records with a value equal to the specified value |
| Contains |
Search for records that contain a string of values specified.
Note: This function includes case sensitivity, so be sure to check your casing when utilizing this operator.
|
| Starts with | Enter the first few characters |
| Ends with | Enter the last few characters |
| Is Blank | Search for all records that have no values for the field but may contain blank spaces |
| Is Null | Search for all records that have no value for the field |
| Is Not | Search for records that do not equal the specified value |
| Doesn’t Contain | Wild card – enter a string not to be contained |
| Doesn’t start with | Wild card – enter a string not to start with |
| Doesn’t end with | Wild card – enter a string not to end with |
| Is not Blank | Search for all records that have a Value in the field; the field is not blank |
| Is not Null | Search for all records that have a Value in the field; the field is not blank |
| Matches a user attribute | Search for records with a value equal to a specific value |
| Matches (advanced) | Search for records with a value equal to the specified values |
Step 4: Filter by Clicking on Visualizations
Another way to quickly apply a filter to the dashboard is by clicking on a specific data element from one of the visualization tiles. For example, if your dashboard contains a pie chart of activity broken down by Organization Type, clicking on either a particular pie slice or option from the legend will automatically add that value as a filter to the entire dashboard.
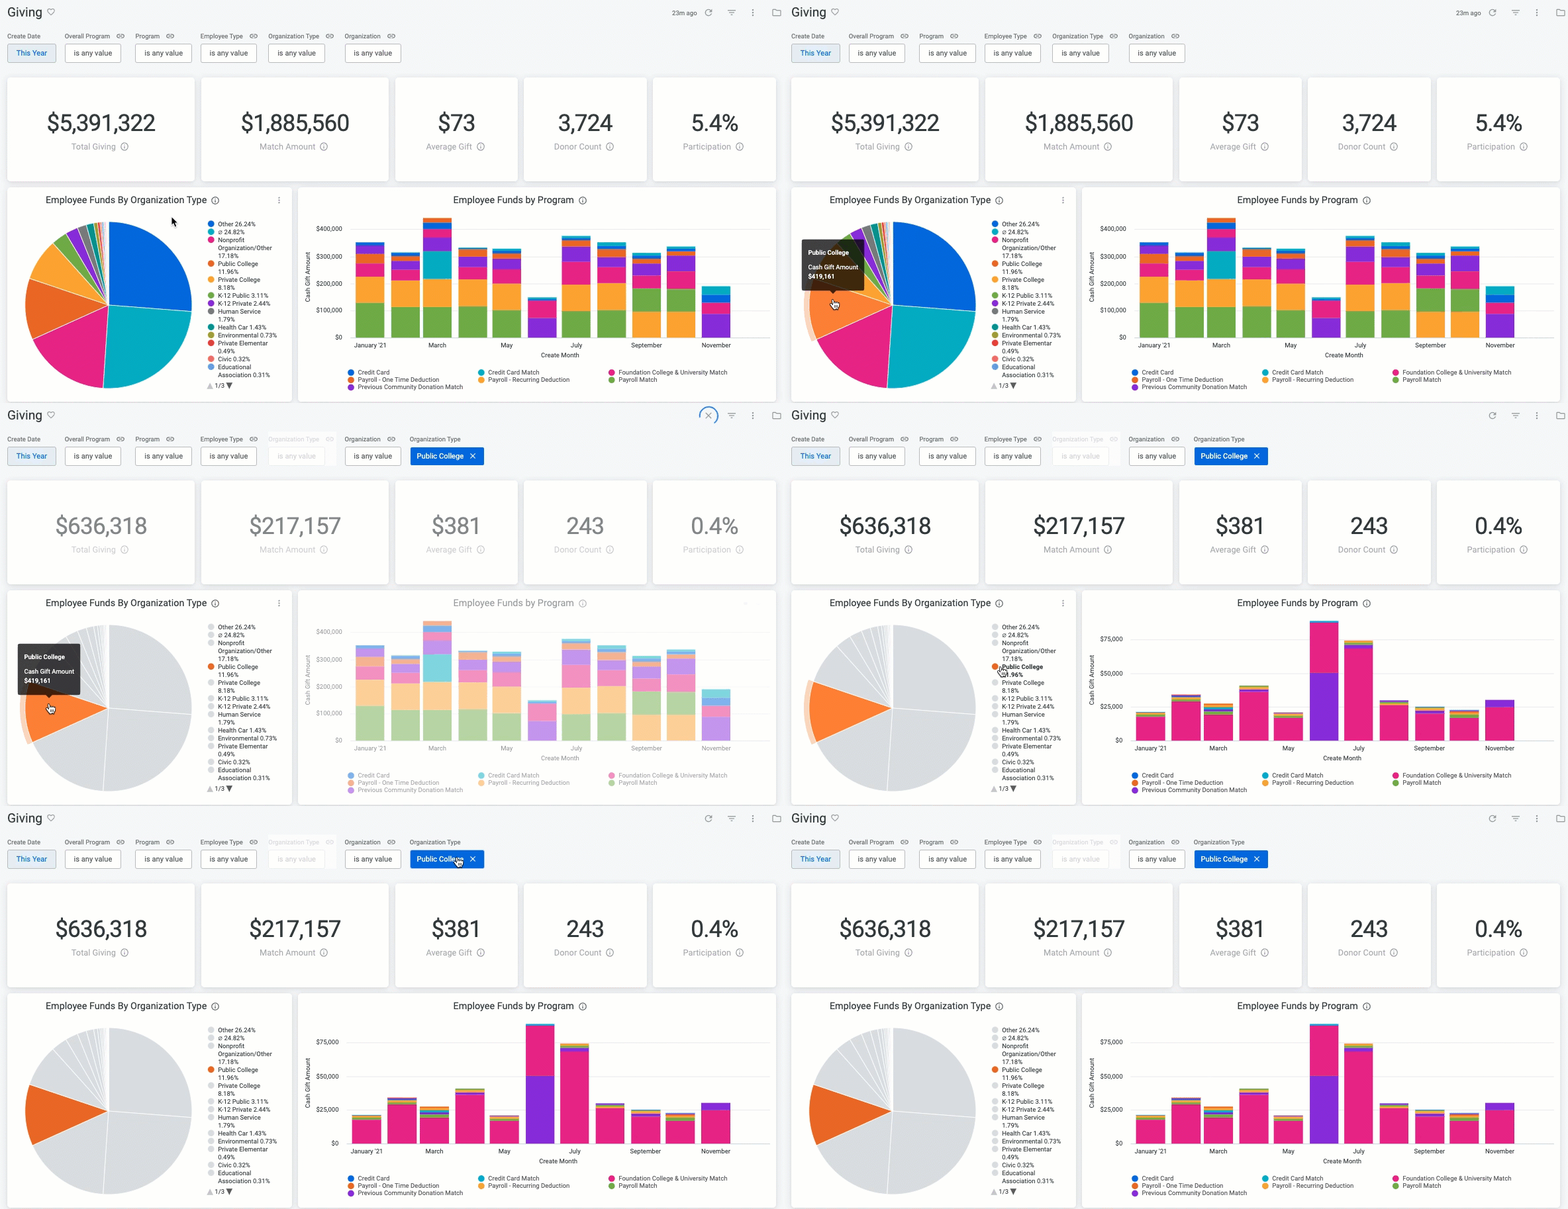
Note: If you are not in edit mode on a dashboard and you drill into a tile, you will see both the filters applied to the dashboard and any filters specific to that particular tile or explore. However, if you are in edit mode on the dashboard and click Edit on a tile, only that tile’s individual filters will appear.
Step 5: Hide and Reset Filters
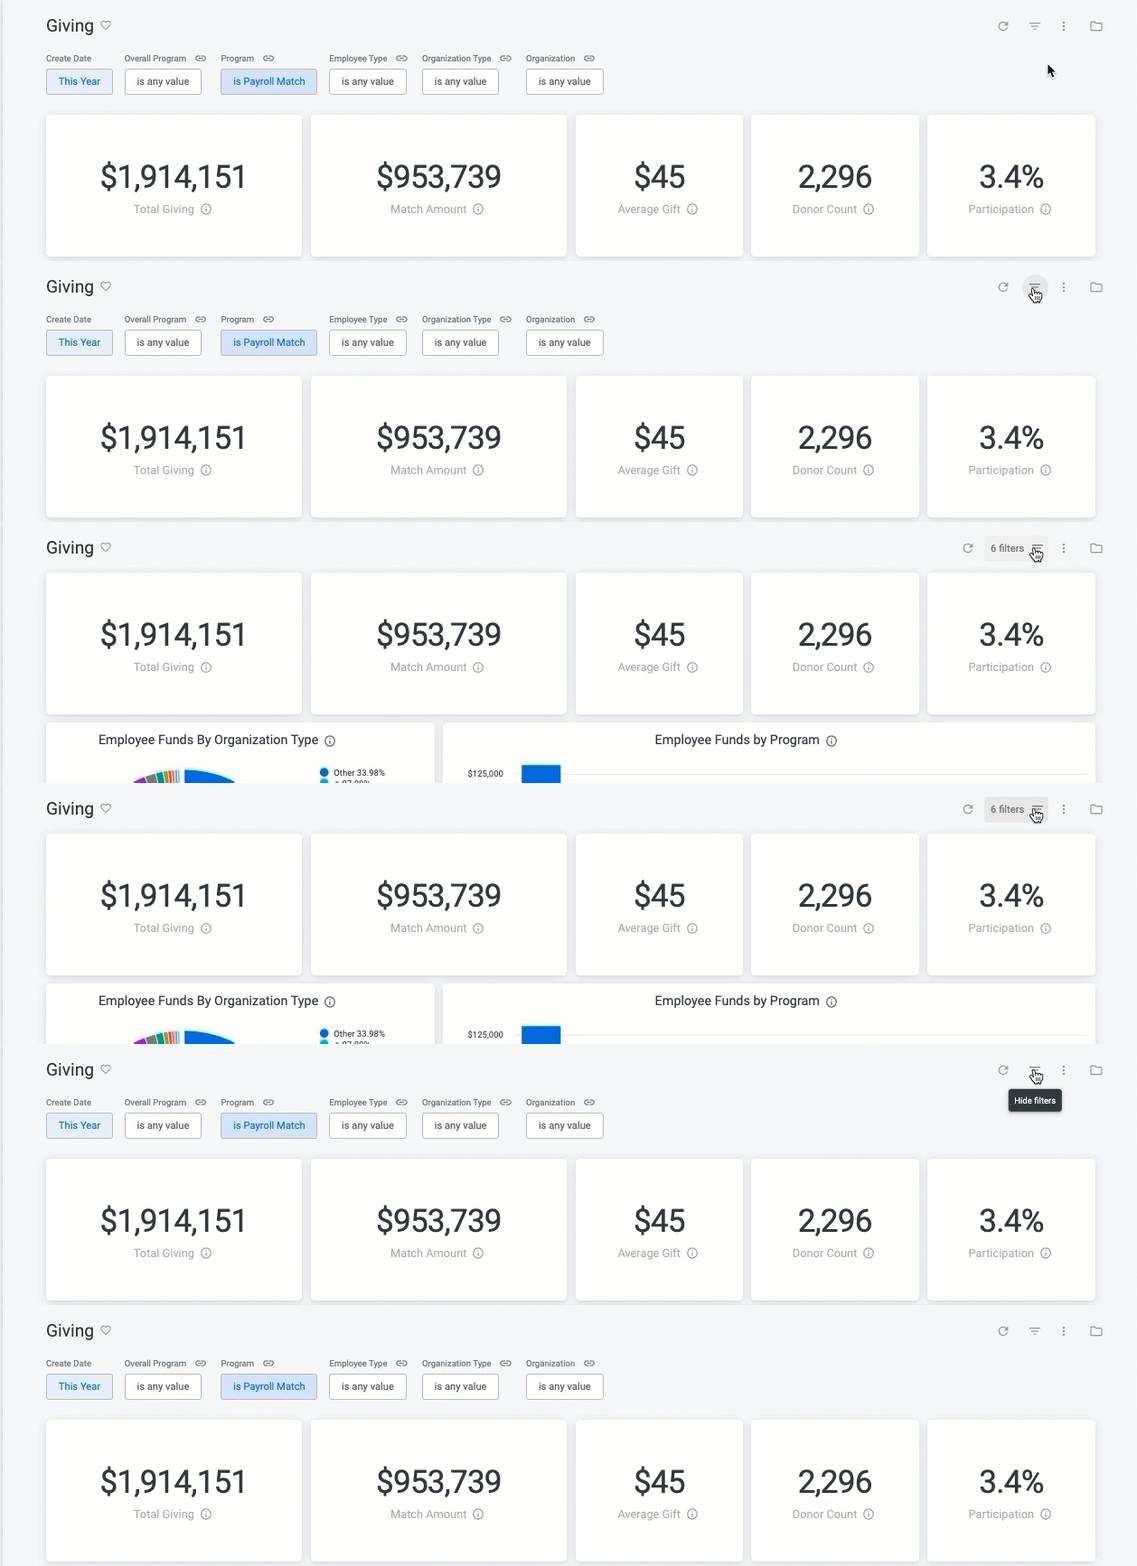
If you need to focus on the visualizations without the distraction of the filters, you can click the filter (three lines) icon in the top right to hide the filters view.
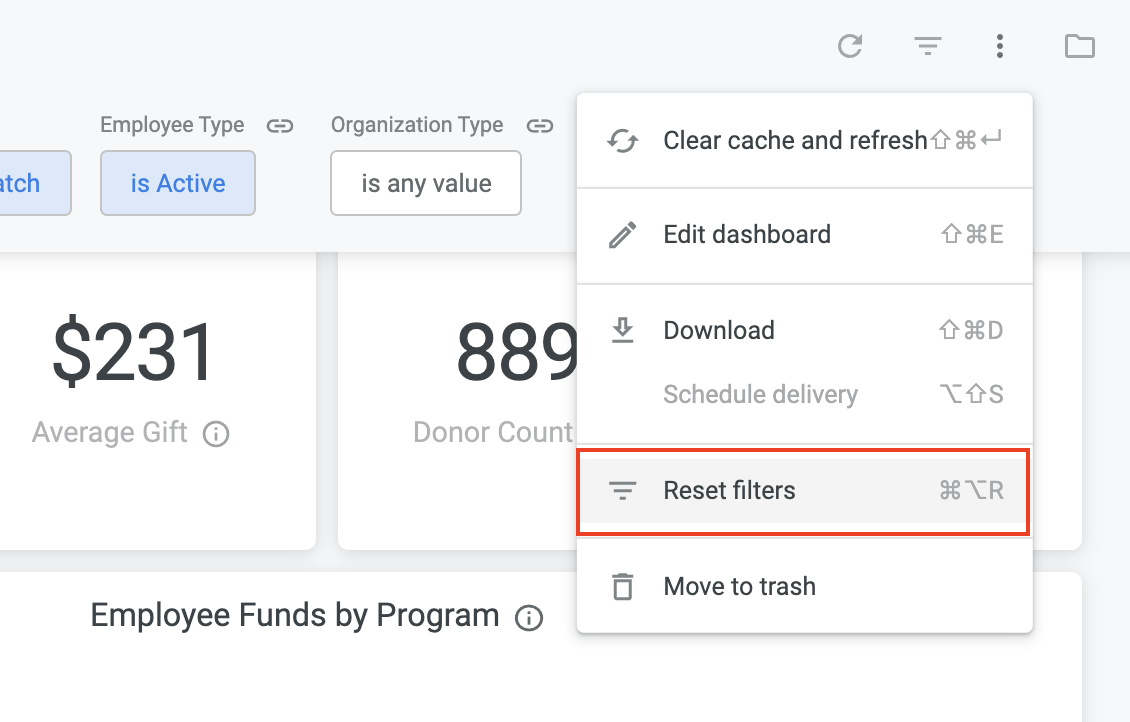
To clear all custom filters that have been set, you can click the "Reset filters" option from the top right vertical ellipses menu.
What else do you need help with?
Not what you're looking for? Navigate to Understanding Insights Dashboard Filtering and Navigation


