Insights users can rescale columns within the Table Visualization of an Explore to adjust their view of the tabular data. Proceed through the following steps to learn how to move and resize columns within the Table Visualization.
Step 1: Access the Insights tab
Log in to the CyberGrants platform and navigate to the Insights tab.

Step 2: Choose an Explore
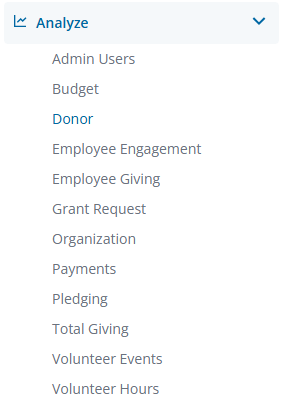
In the left-hand menu, select the "Analyze" option to view and choose from the available Explores.
Step 3: Build or select a report
Create a new report by either building it from scratch by adding relevant fields or if any prebuilt Quick Start reports are available, select one of those as a starting point.
Step 4: Access the Table Visualization type
The Table icon in the Visualization toolbar will allow you to view the report as a table listing the data in individual columns.

Step 5: Move columns
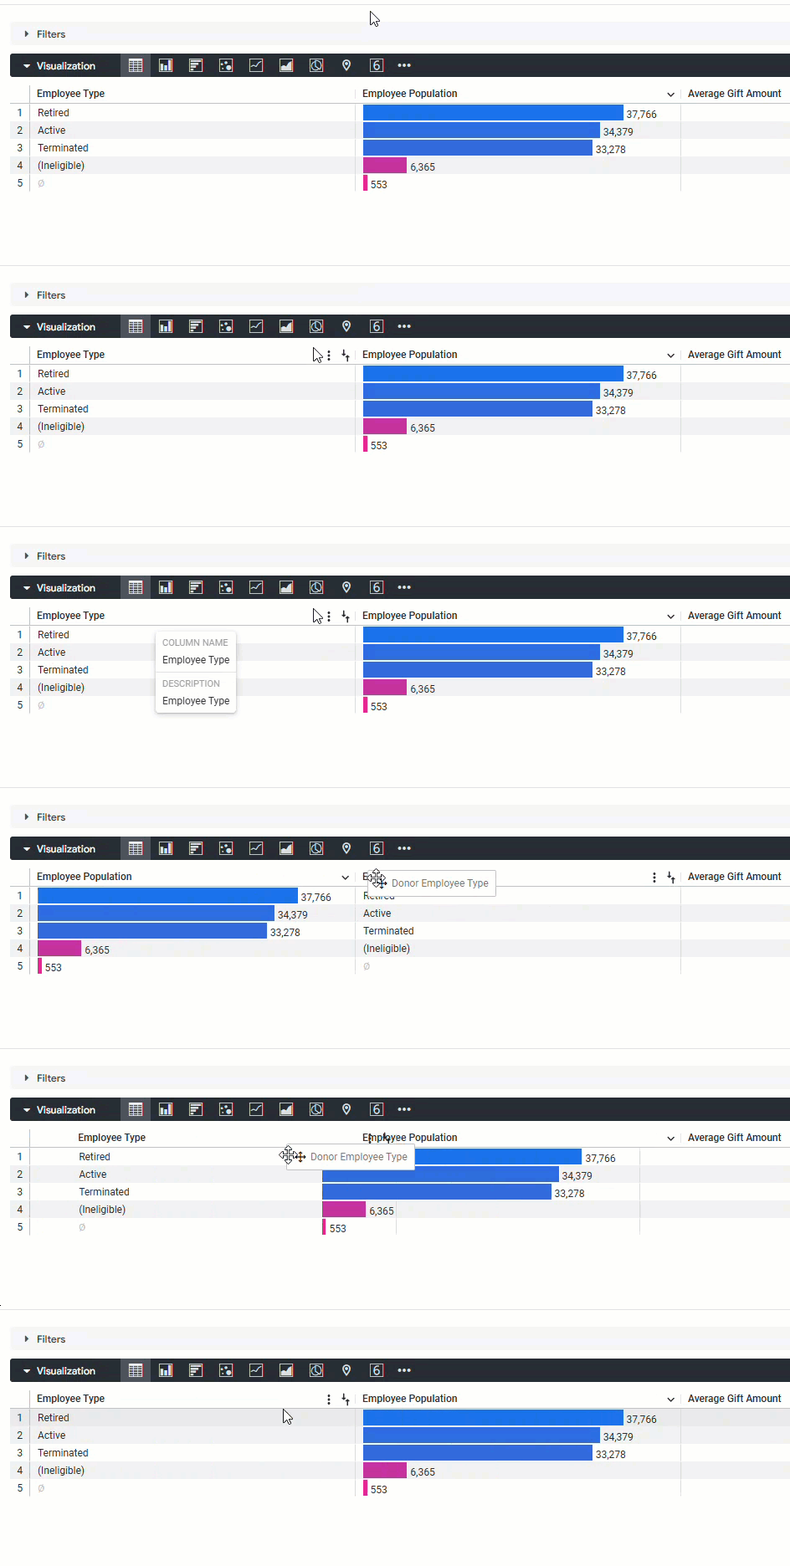
Clicking and dragging column headers in the table visualization allows you to move any column, including pivot groups and individual pivot columns, to any other location in the visualization. The order of the columns within the data table will not change.
Step 6: Resize columns
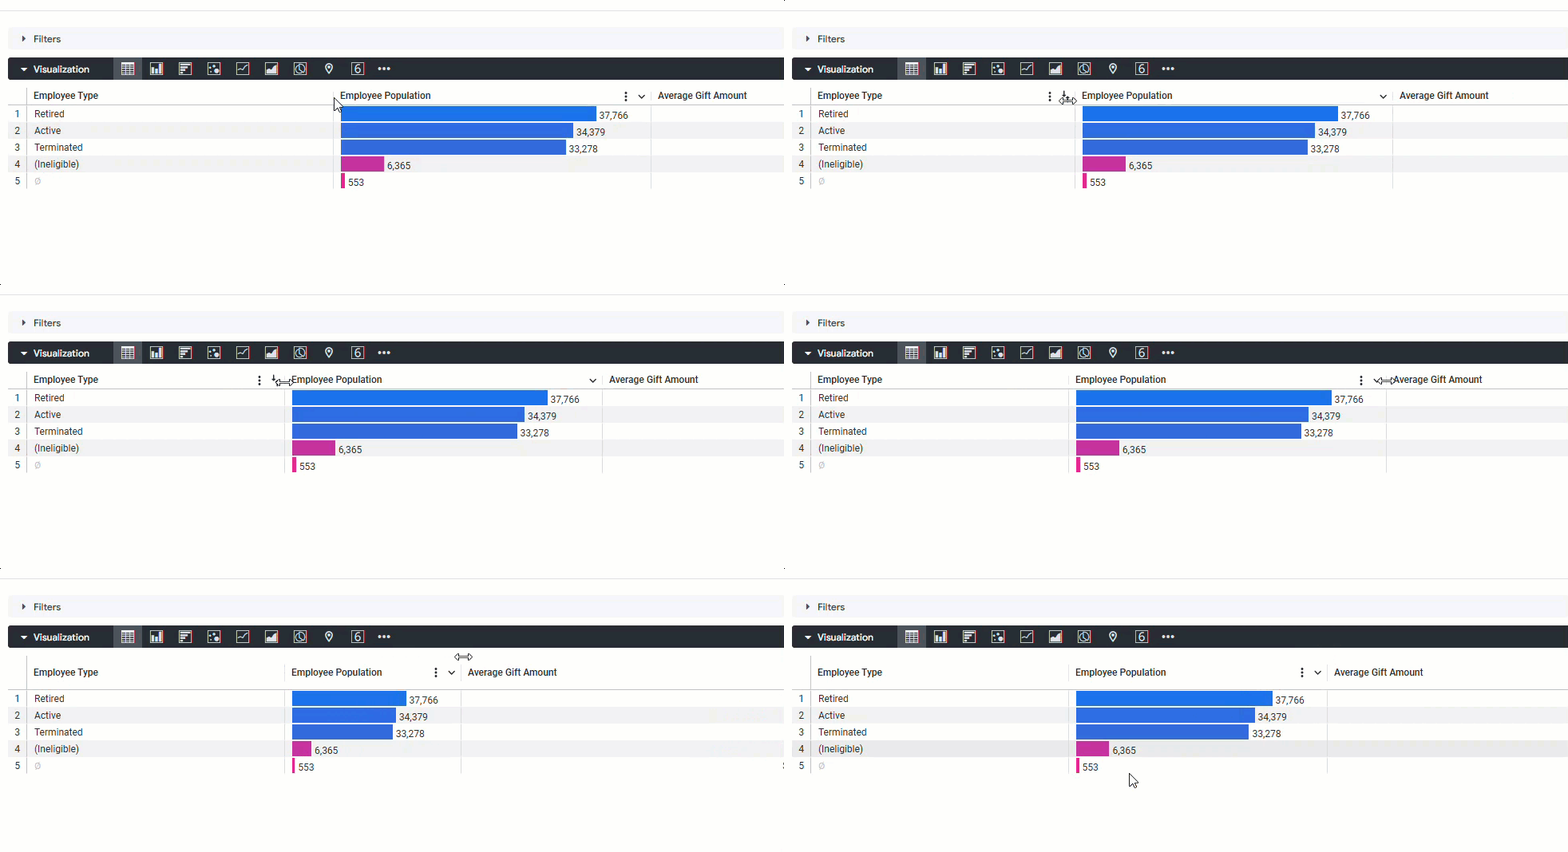
To manually resize columns, click the right border of the column header and drag it left or right.
What else do you need help with?
Not what you're looking for? Navigate to Understanding the Insights Table Visualization


