The Formatting Menu options provide Insights users the ability to create visually compelling and informative Table Visualizations within an Insights Explore, enhancing the overall presentation and analysis of your data.
Proceed as follows to access the Formatting Menu options in the Table Visualization.
Step 1: Access Insights and choose an Explore
Log in to the CyberGrants platform and navigate to the Insights tab.

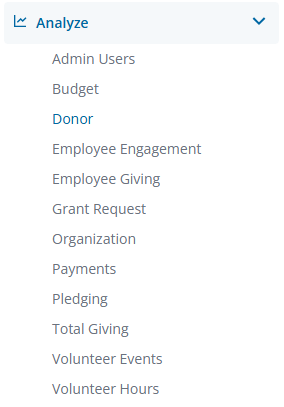
In the left-hand menu, select the "Analyze" option to view and choose from the available Explores.
Step 2: Build or select a report
Create a new report by either building it from scratch by adding relevant fields or if any prebuilt Quick Start reports are available, select one of those as a starting point.
Step 3: Access the Table Visualization type
The Table icon in the Visualization toolbar will allow you to view the report as a table listing the data in individual columns.

Step 4: View the Formatting Menu
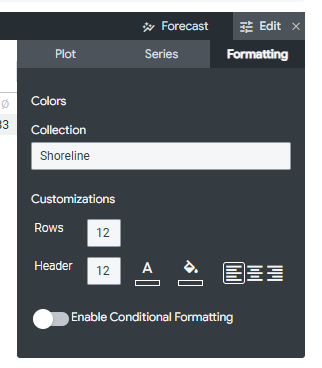
Click Edit in the right corner of the Visualization toolbar to access the Table Visualization Formatting Menu options.
Step 5: Create a themed visualization
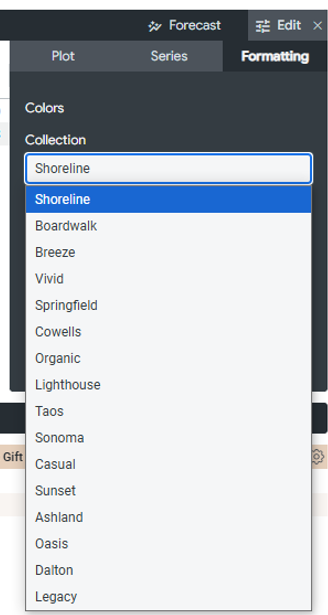
Under the Colors heading, access the Collection option. This allows you to create themed visualizations and dashboards that look good together. Choosing a color collection from the Collection drop-down menu determines the palettes available for conditional formatting rules or cell visualizations.
Step 6: Customize the table's appearance
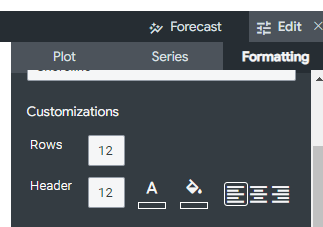
The Customizations option allow you to customize each column in the visualization, including rows and headers.
- Rows - Allows you to set the font size for cell text between 1 and 99 points.
- Header - Allows you to set the font size, text color, background fill color, and horizontal alignment for column headers. Header font size can range between 1 and 99 points.
You can, also, adjust the color for each, as well as the positioning.
Step 7: Enable Conditional Formatting
Conditional Formatting can only be turned on when subtotals are not present and the Cell Visualization feature has been turned off.
- Include Totals - If conditional formatting is enabled, Include Totals toggles whether totals are included in the color coding scheme.
- Include Null Values as Zero - If conditional formatting is enabled, Include Null Values as Zero toggles whether null values should be represented as a zero.
Step 8: Add a Conditional Formatting Rule
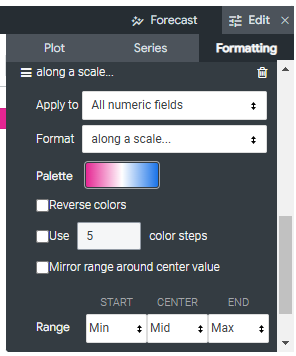
When Conditional Formatting is on, you can define rules that color code your table, either on a scale (i.e. gradient, based on low to high amounts) or by specifying values that are of interest (i.e. highlight all values over 5,000).
What else do you need help with?
Not what you're looking for? Navigate to Understanding the Insights Table Visualization


