Insights users can access column options within the Table Visualization of an Explore to customize their view of data in a report. Proceed through the following steps to learn more about accessing the Table Visualization column options available through Insights.
Step 1: Access Insights and choose an Explore
Log in to the CyberGrants platform and navigate to the Insights tab.

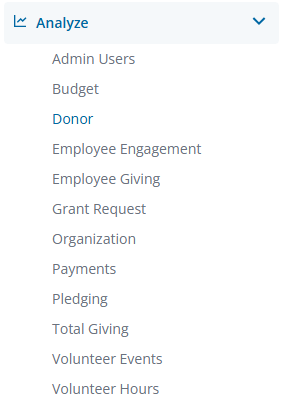
In the left-hand menu, select the "Analyze" option to view and choose from the available Explores.
Step 2: Build or select a report
Create a new report by either building it from scratch by adding relevant fields or if any prebuilt Quick Start reports are available, select one of those as a starting point.
Step 3: Access the Table Visualization type
The Table icon in the Visualization toolbar will allow you to view the report as a table listing the data in individual columns.

Step 4: View the additional column options
Hover over the vertical ellipsis (three dots) menu on any column to access additional column options.
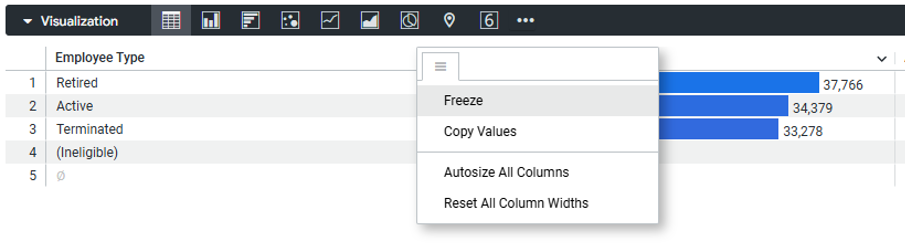
- Freeze: Freeze one or more table columns to the left side of the chart during horizontal scrolling.
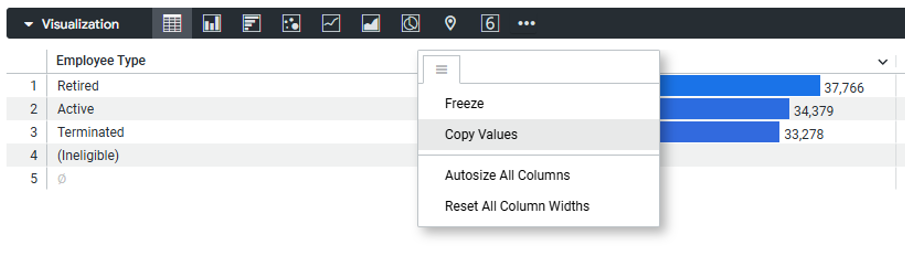
- Copy Values: Copy the column header and all the values below within that column.
Step 5: Resize the Columns
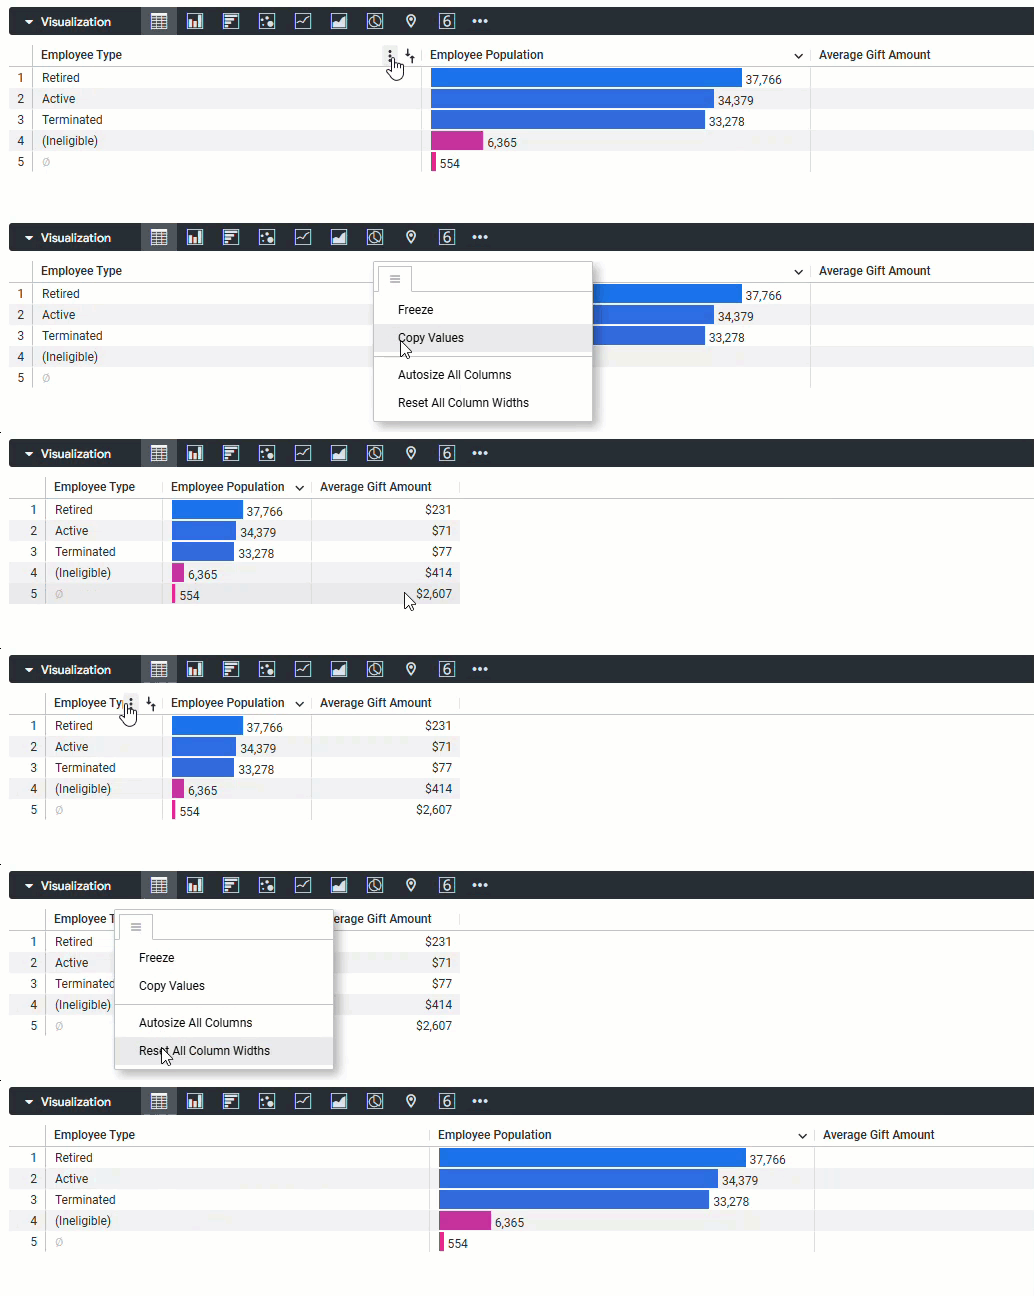
- Autosize All Columns: Size the width of each column to fit its column heading name or its longest data value.
- Reset All Column Widths: Resize each column to its default width.
What else do you need help with?
Not what you're looking for? Navigate to Understanding the Insights Table Visualization


