The Employee Engagement Benchmarking dashboard reports provide valuable information for Insights users with Employee Engagement programs. These reports allow you to compare your company's program data against an aggregated, anonymized benchmark from all CyberGrants customers. By understanding how your company's performance measures up to the industry standard, you can make informed decisions to optimize your Employee Engagement initiatives.
- To learn more about each dashboard visualization tile, select the info icon that provides a more detailed description of the logic and filters being factored into the tile.
Proceed as follows to view and better understand the purpose of each report within the dashboard.
Step 1: Access the Dashboard
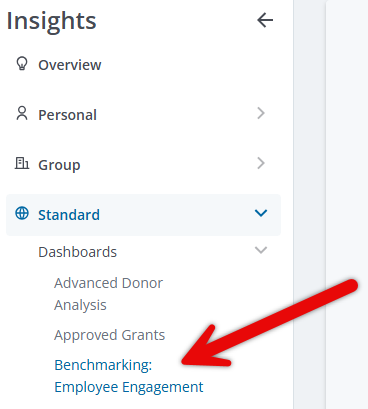
Access the Insights platform and navigate to the "Benchmarking: Employee Engagement” dashboard under the "Standard” dashboards section.

Step 2: Understand the Dashboard Layout
The dashboard features a left-hand column displaying the benchmark data in black text, and a right-hand column showcasing your company's data in purple text.
- If your company does not have a specific program reflected in the Benchmark data, that program will not be displayed in the "My Company" section of the comparison.

Step 3: Review the Dashboard Reports
The following are descriptions for each report included in the Employee Engagement Benchmarking dashboard.
Participation Rate (%) Report
This report provides an analysis of the benchmark (left-side tile) average participation rate (%) for the selected year in comparison with your company's data (right-side tile), excluding participation with a status of ‘canceled' or 'rejected' and any donors who might be marked as friend/family, as the donor amount is sourced from the HR database.

Annual Averages Per Employee
This report presents an analysis of the benchmarking (left-side tile) averages for the total gift amount, total match amount, hours volunteered, and engagement count per employee for the selected year in comparison with your company's data (right-side tile), excluding participation with the status of 'canceled' or 'rejected'.

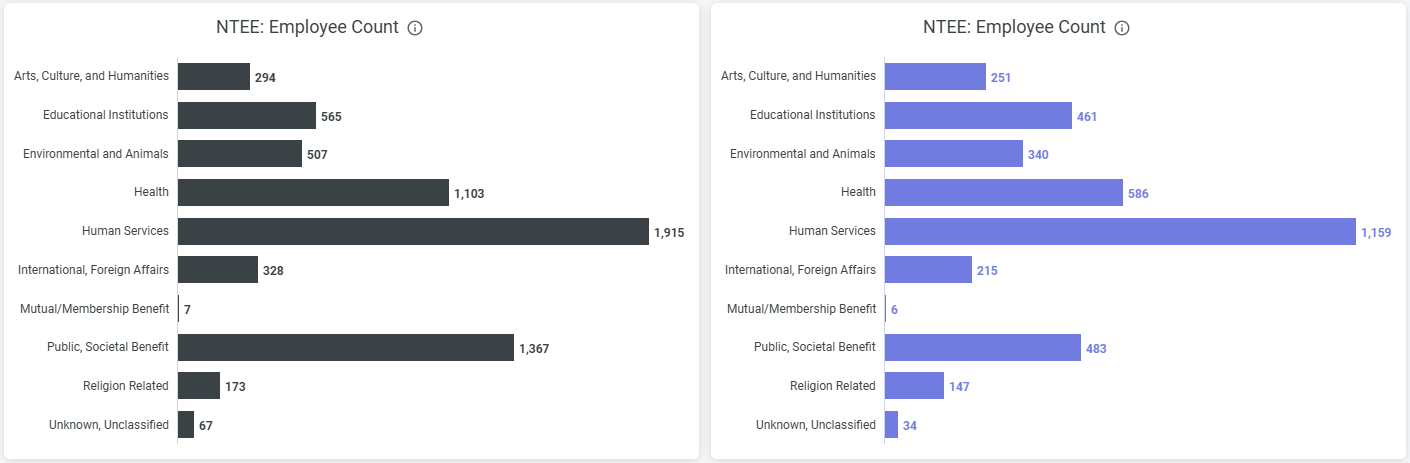
NTEE: Employee Count Report
This report provides an analysis of the benchmarking (left-side tile) average count of employees who has participated, donated, or volunteered within the selected year in comparison with your company's data (right-side tile), categorized by each organization's standard NTEE classification, excluding those with a status of 'canceled' or 'rejected'.
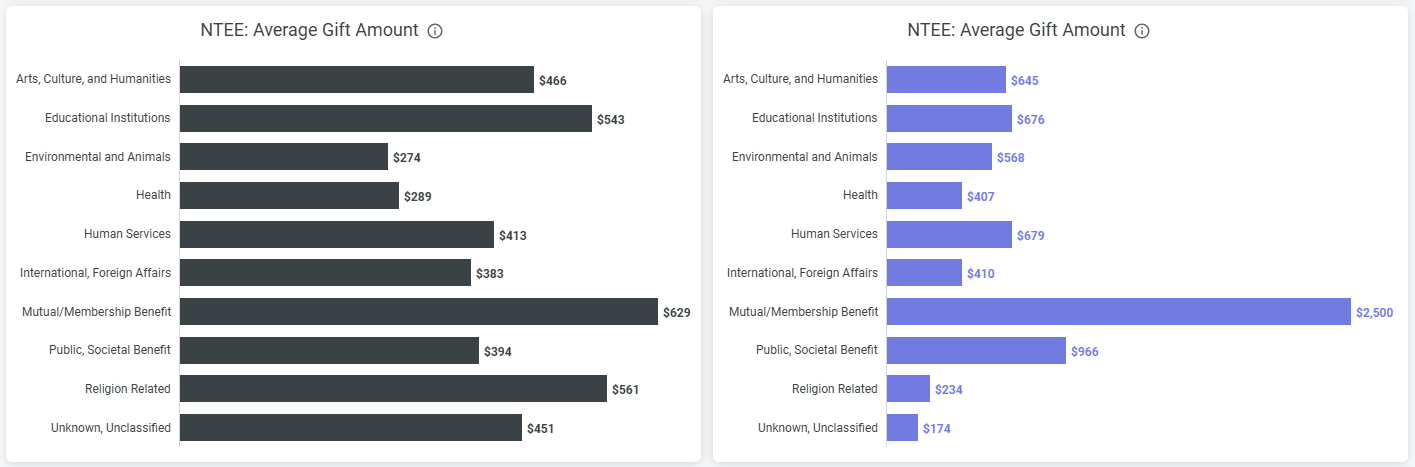
NTEE: Average Gift Amount Report
This report provides an analysis of the benchmark (left-side tile) average total gift amount per employee for the selected year in comparison with your company's data (right-side tile), categorized by the organization's standard NTEE code, excluding contributions with the status of 'canceled' or 'rejected'.
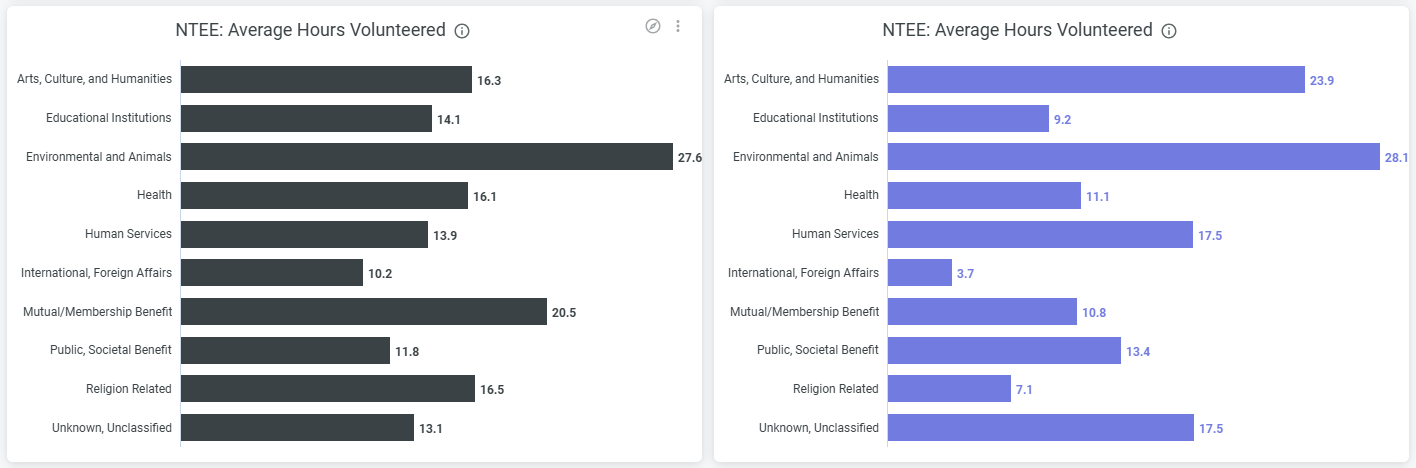
NTEE: Average Hours Volunteered Report
This report presents an analysis of the benchmark (left-side tile) average total hours volunteered per employee for the selected year in comparison with your company's data (right-side tile), categorized by the organization's standard NTEE classification, and excluding participation with the status of 'canceled' or 'rejected'.
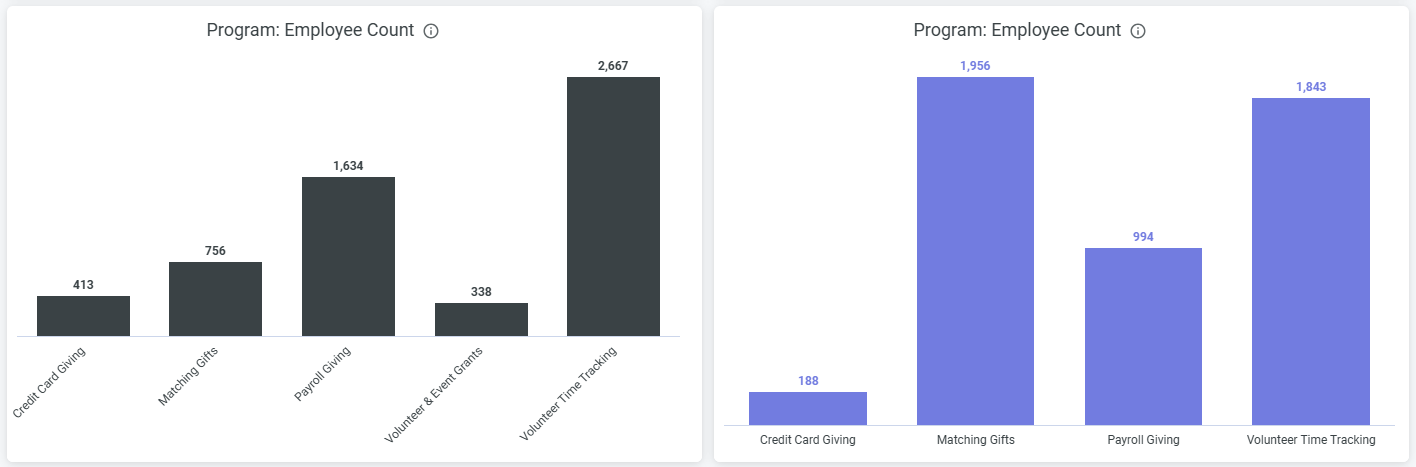
Program: Employee Count Report
This report shows an analysis of the benchmark (left-side tile) average count of employees who has participated, donated, or volunteered within the selected year in comparison with your company's data (right-side tile) across various program categories, excluding those with the status of 'canceled' or 'rejected'.
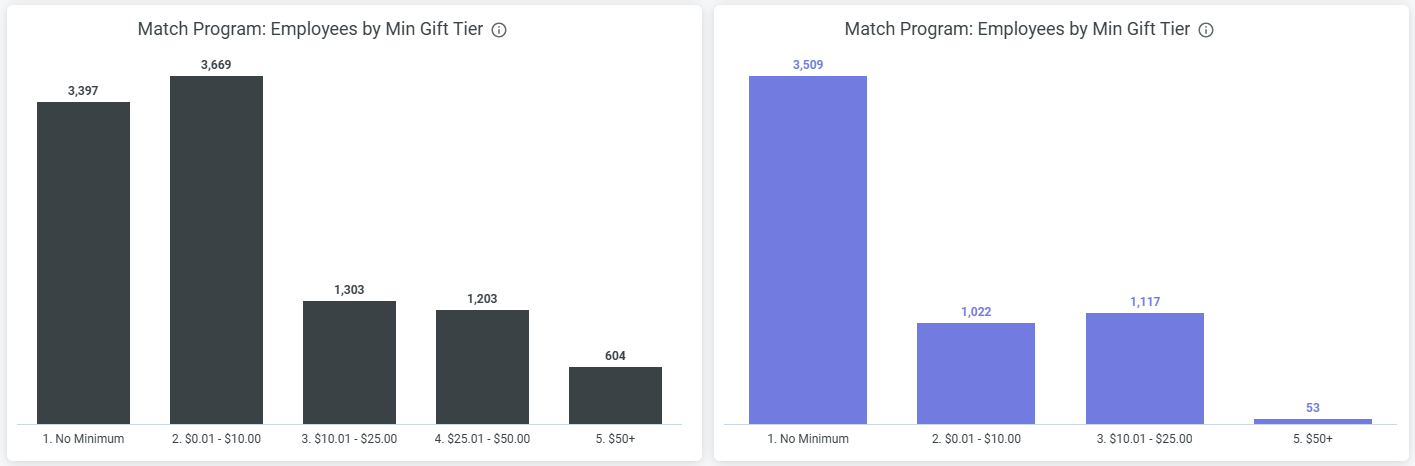
Match Program: Employees by Min Gift Tier Report
This report provides the benchmark (left-side tile) average count of employees who have participated in a company match program in the selected year compared with your company's data (right-side tile), excluding those with a 'canceled' or 'rejected' status.
- This analysis presents the average employee count by minimum gift tier, allowing for a comparison of your company's match program thresholds to the industry standard.
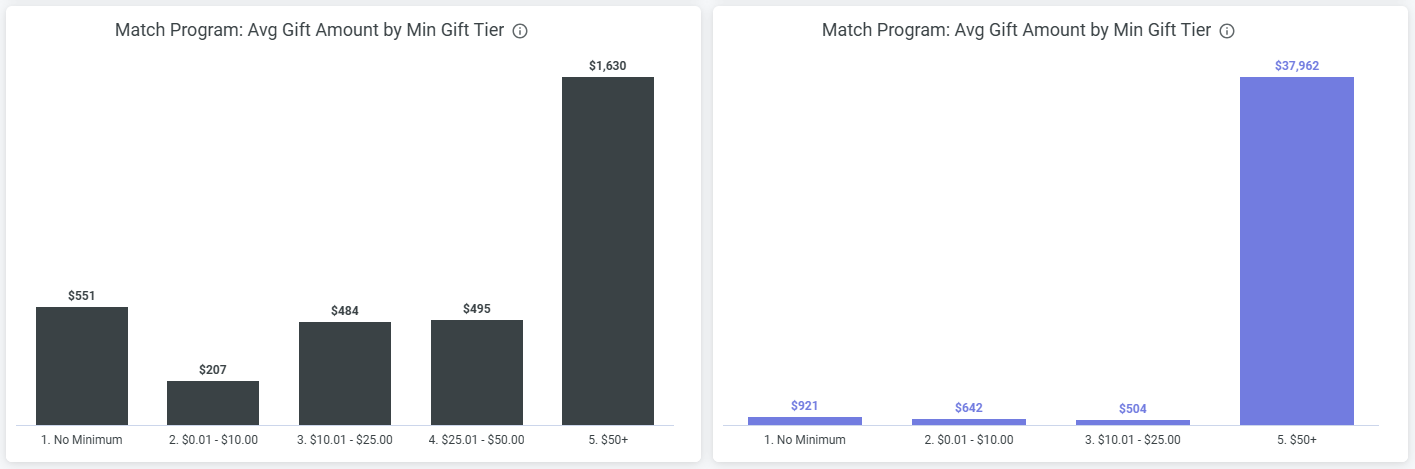
Match Program: Avg Gift Amount by Min Gift Tier Report
This report, similar to the Match Program: Employees by Min Gift Tier Report, displays an analysis of the benchmark (left-side tile) average total gift amount for an employee who has participated in a company match program in comparison with your company's data (right-side tile) in the selected year, excluding participation with the status of 'canceled' or 'rejected'. Various minimum gift amount rules are met to provide insight into the average gift amounts from employees at different minimum gift tiers.
What else do you need help with?
Not what you're looking for? Return to Understanding Insights Employee Engagement Benchmark Reporting or navigate to Insights Standard Dashboards Overview


