The Insights Employee Engagement Benchmark Dashboard provides a valuable understanding of your organization's employee engagement data as it compares to that of your CyberGrants peers by highlighting specific metrics, trends, and areas for improvement. Insights Analysts can further analyze and customize their view of the data behind each report by accessing an Explore from the individual tiles within the dashboard to gain a deeper understanding of their program's data as it relates to the benchmark.
- Insights Analysts can proceed as follows to navigate the Employee Engagement Benchmark Dashboard by further analyzing data through an Explore.
Step 1: Access the Dashboard
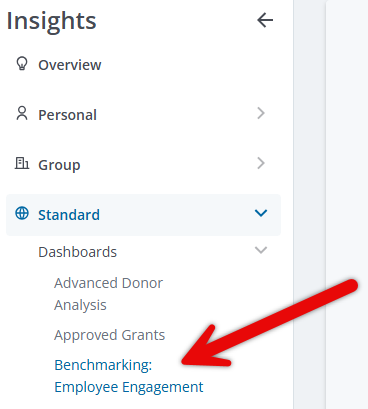
Access the Insights platform and navigate to the "Benchmarking: Employee Engagement” dashboard under the "Standard” dashboards section.

Step 2: Select "Explore from Here"
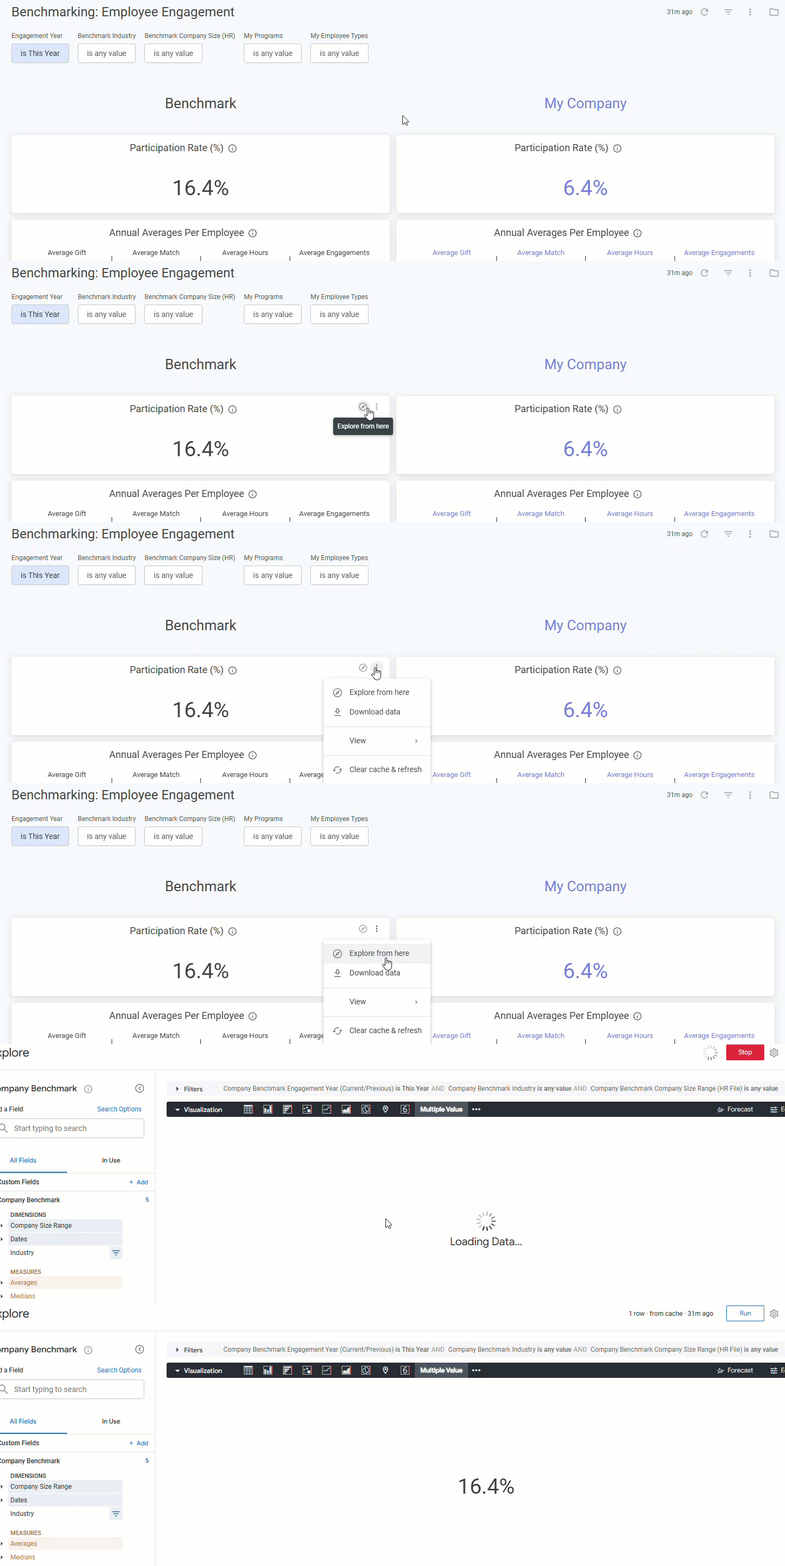
Hover over the top right corner of the tile you wish to "Explore from here". This will take you to the corresponding Insights Explore (Looker) including the data table and fields for the report analysis. Alternatively, you can select the vertical ellipsis in the top right corner of the tile and click "Explore from here" to access the Explore view.
- "Explore from Here" is an option for any tile on the dashboard. However, depending on the tile being explored upon, you will either be taken to one of four Benchmark explores or the standard Employee Engagement explore.
Step 3: Understand the Benchmark and My Company Tile Explore Limitations
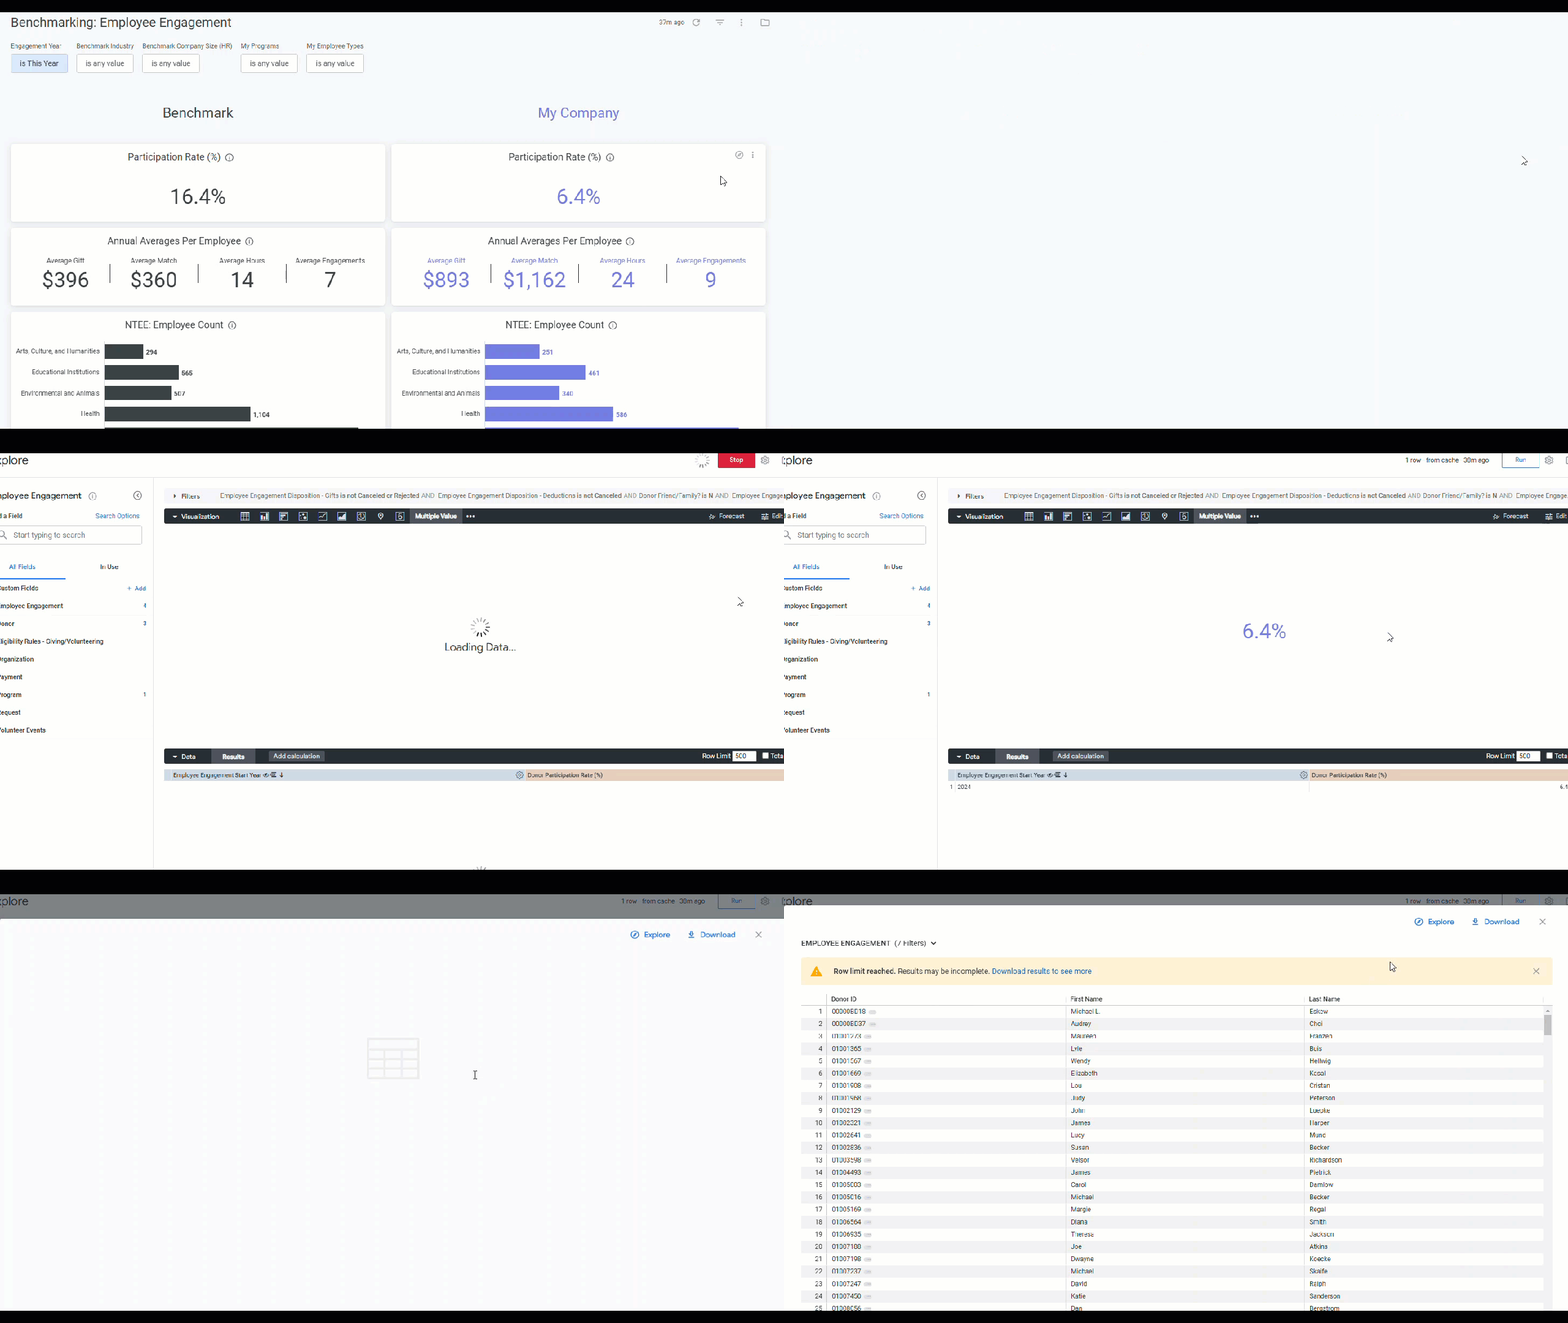
The "Benchmark" tiles (black text) cannot be drilled upon due to Bonterra's data privacy agreement, as we cannot display the data of other CyberGrants product users. You can choose to include or remove a limited set of data filters through the Explore view.
The "My Company" tiles (purple text) will provide your company's data in an Explore data format, allowing you to further analyze your organization's employee engagement performance.
Step 4: Customize the Explore View
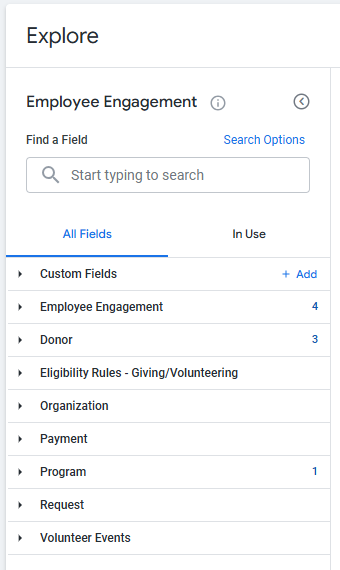
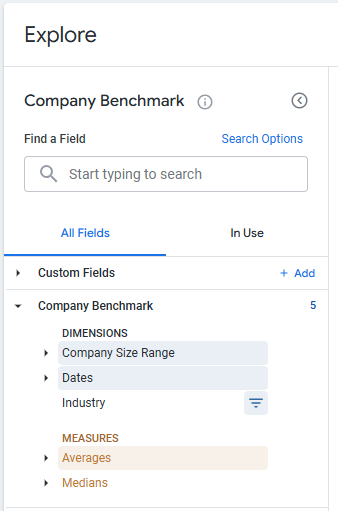
From the Explore, you can change the selected fields to display data in a different format.
- Accessing an Explore from a "My Company" tile will provide additional data fields and filter options specific to your company's program data, enabling a more detailed analysis.
- Accessing an Explore from the “Benchmark” tile provides limited availability to customize the data, allowing users only to include or exclude a limited number of filter options as this information is protected under Bonterra’s data privacy agreement.
To learn more about viewing program data through an Insights Explore, visit Navigating Insights Explores Basics.
Step 5: Save or Download the Explore
The Explore can be downloaded or saved as an individual analysis separate from the Employee Engagement Benchmark Dashboard.
Step 6: Drill into Your Company's Data
For some of the tiles (such as Program Participation and NTEE Category Participation), you can drill into your company's data to view the additional details about the donors that make up your donor count. This provides a more detailed understanding of your company's employee engagement performance.
- NOTE: This drilling capability is not accessible for any of the benchmarking values or any "My Company" tiles that involve average amounts per employee.
What else do you need help with?
Not what you're looking for? Return to Understanding Insights Employee Engagement Benchmark Reporting or navigate to Insights Standard Dashboards Overview


