Analysts have the flexibility to add tiles to dashboards in an ad hoc manner allowing them to represent their program's data through enhanced, individual, custom visualizations. They can leverage tools available to manage the size, arrangement, and overall presentation of dashboard tiles, ensuring the appropriate usability of their program's data.
The following are some key points to acknowledge before proceeding.
- Using this feature resets the order of the tiles to the order in which they were originally added to the dashboard. Exercise caution, as this can significantly alter the layout of your dashboard.
- Tile tile sizes will remain responsive to the size of the dashboard.
To learn about adding tiles to dashboards, follow through the below steps.
Step 1: Edit Dashboard
Navigate to the dashboard you are updating and click the vertical ellipses menu in the top right corner to select "Edit dashboard."
- This will put you in "Editing" mode, indicated by a blue banner along the top of the dashboard.
Step 2: Add a Tile
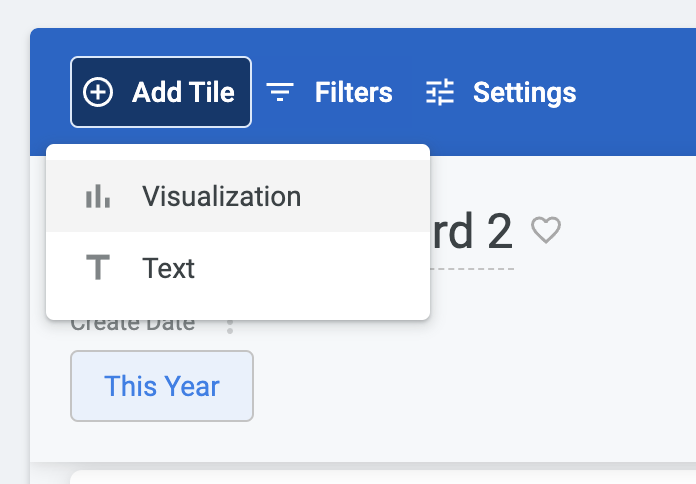
Select the "Add Tile" option in the top left corner of the dashboard and choose from the following options:
- Visualization - A visualization tile is a visual representation of a specified data set/report.
- Text - A text tile is simply a block of text that can be added to help provide more clarity over what the dashboard entails.
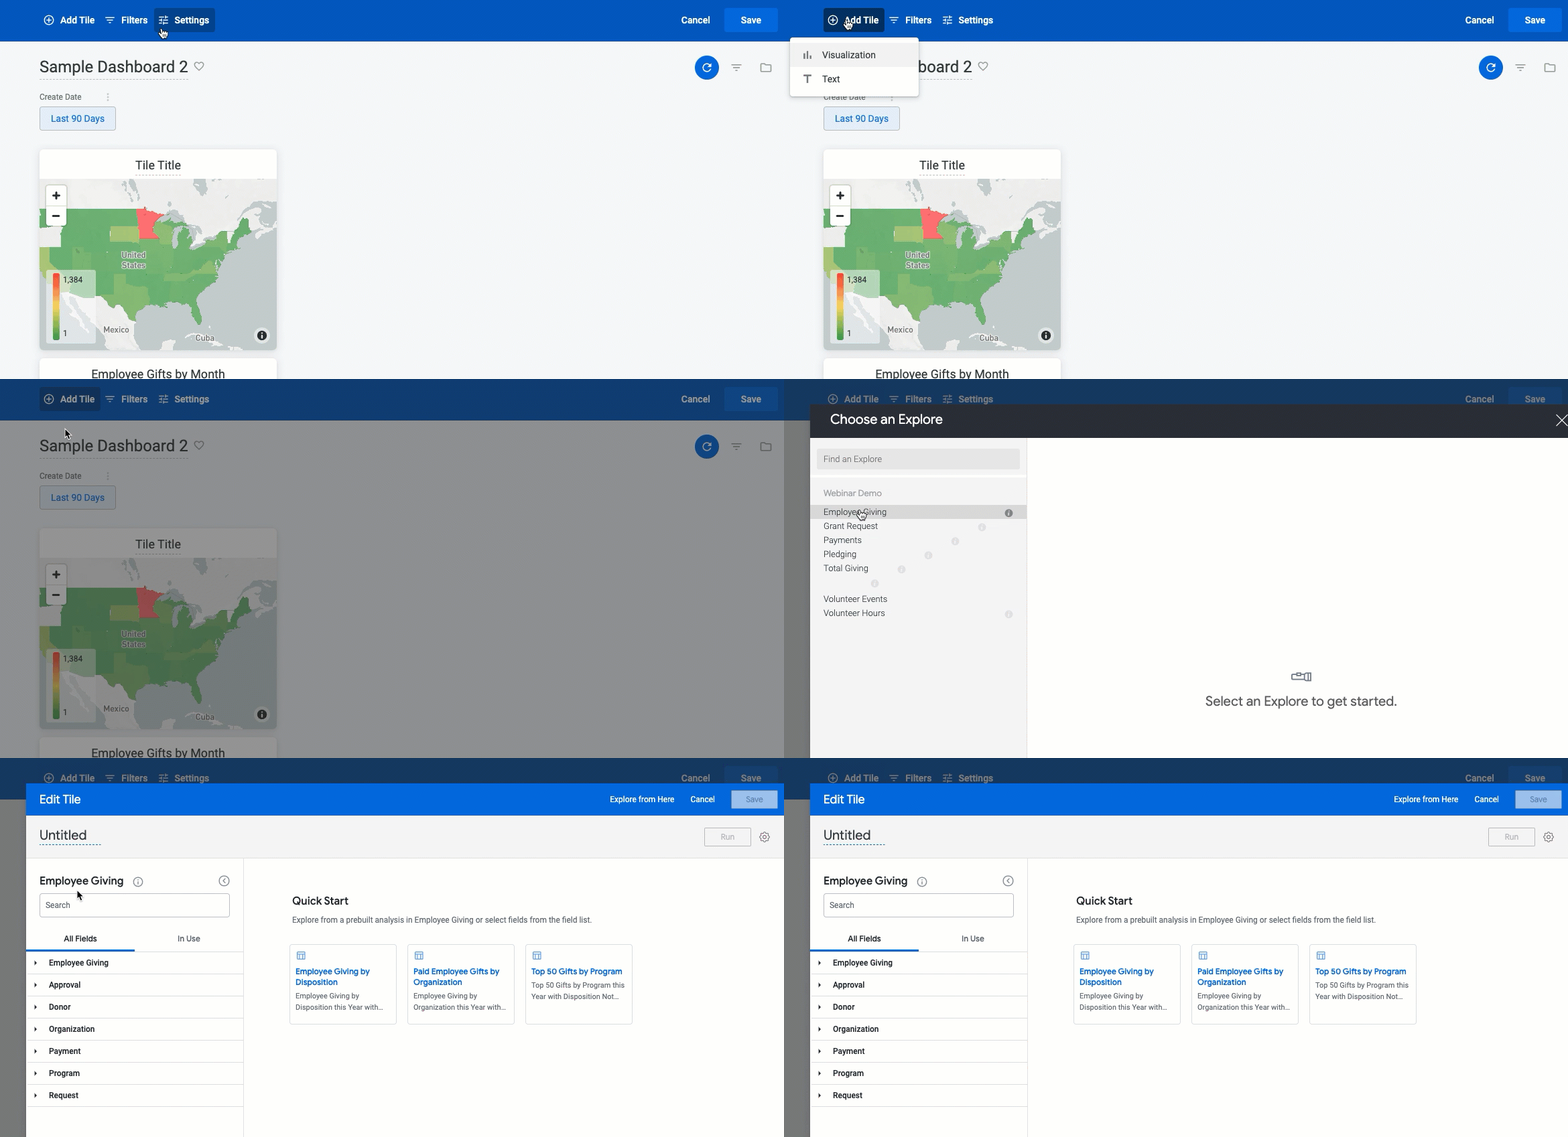
Create a Visualization Tile
When you select to create a Visualization tile, you will be presented with a modal where you can choose from one of the standard Explore options and begin to build another ad hoc analysis as needed.
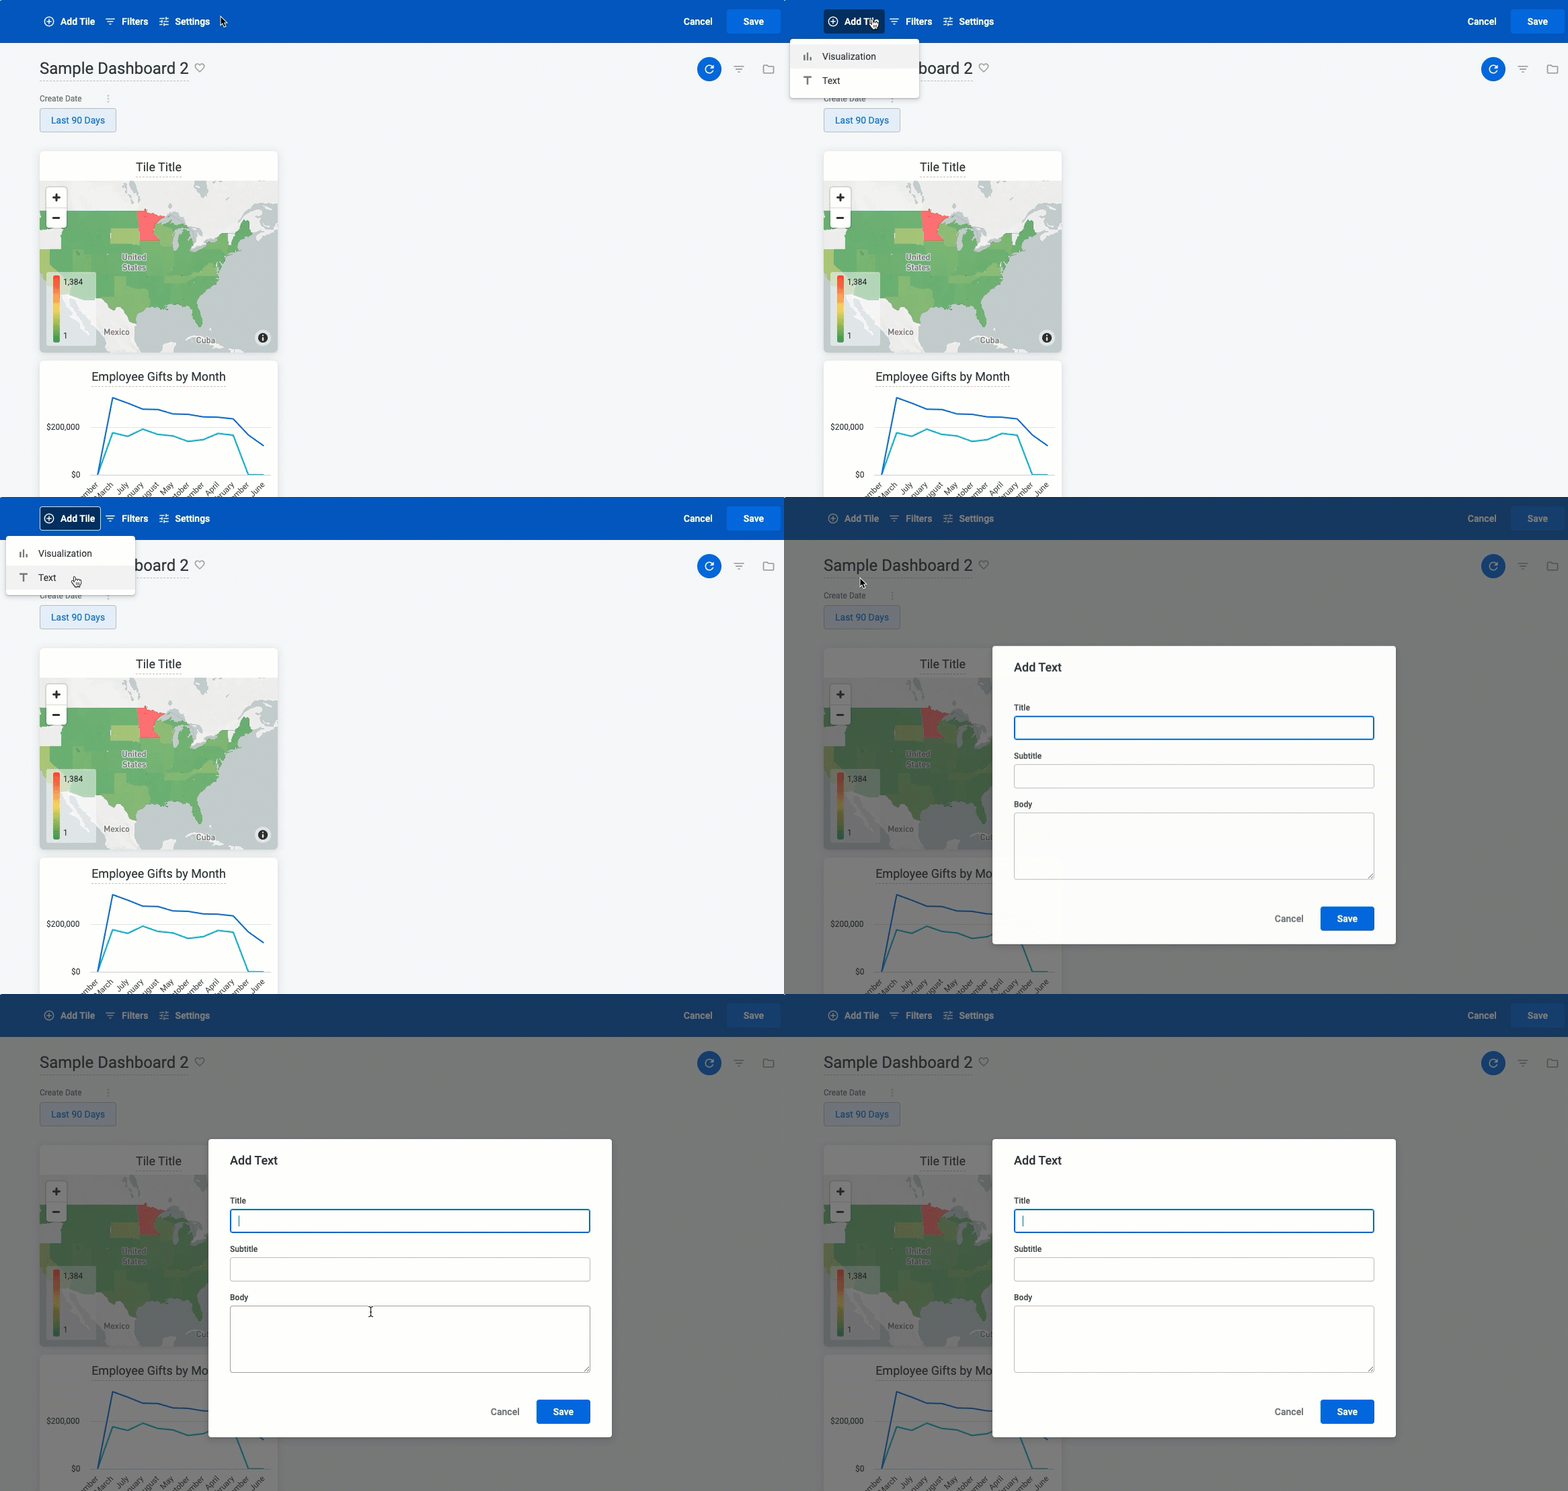
Create a Text Tile
When you create a Text tile, you will be presented with a modal where you can enter a Title, Subtitle, and Body.
Step 3: Resize and Arrange Tiles
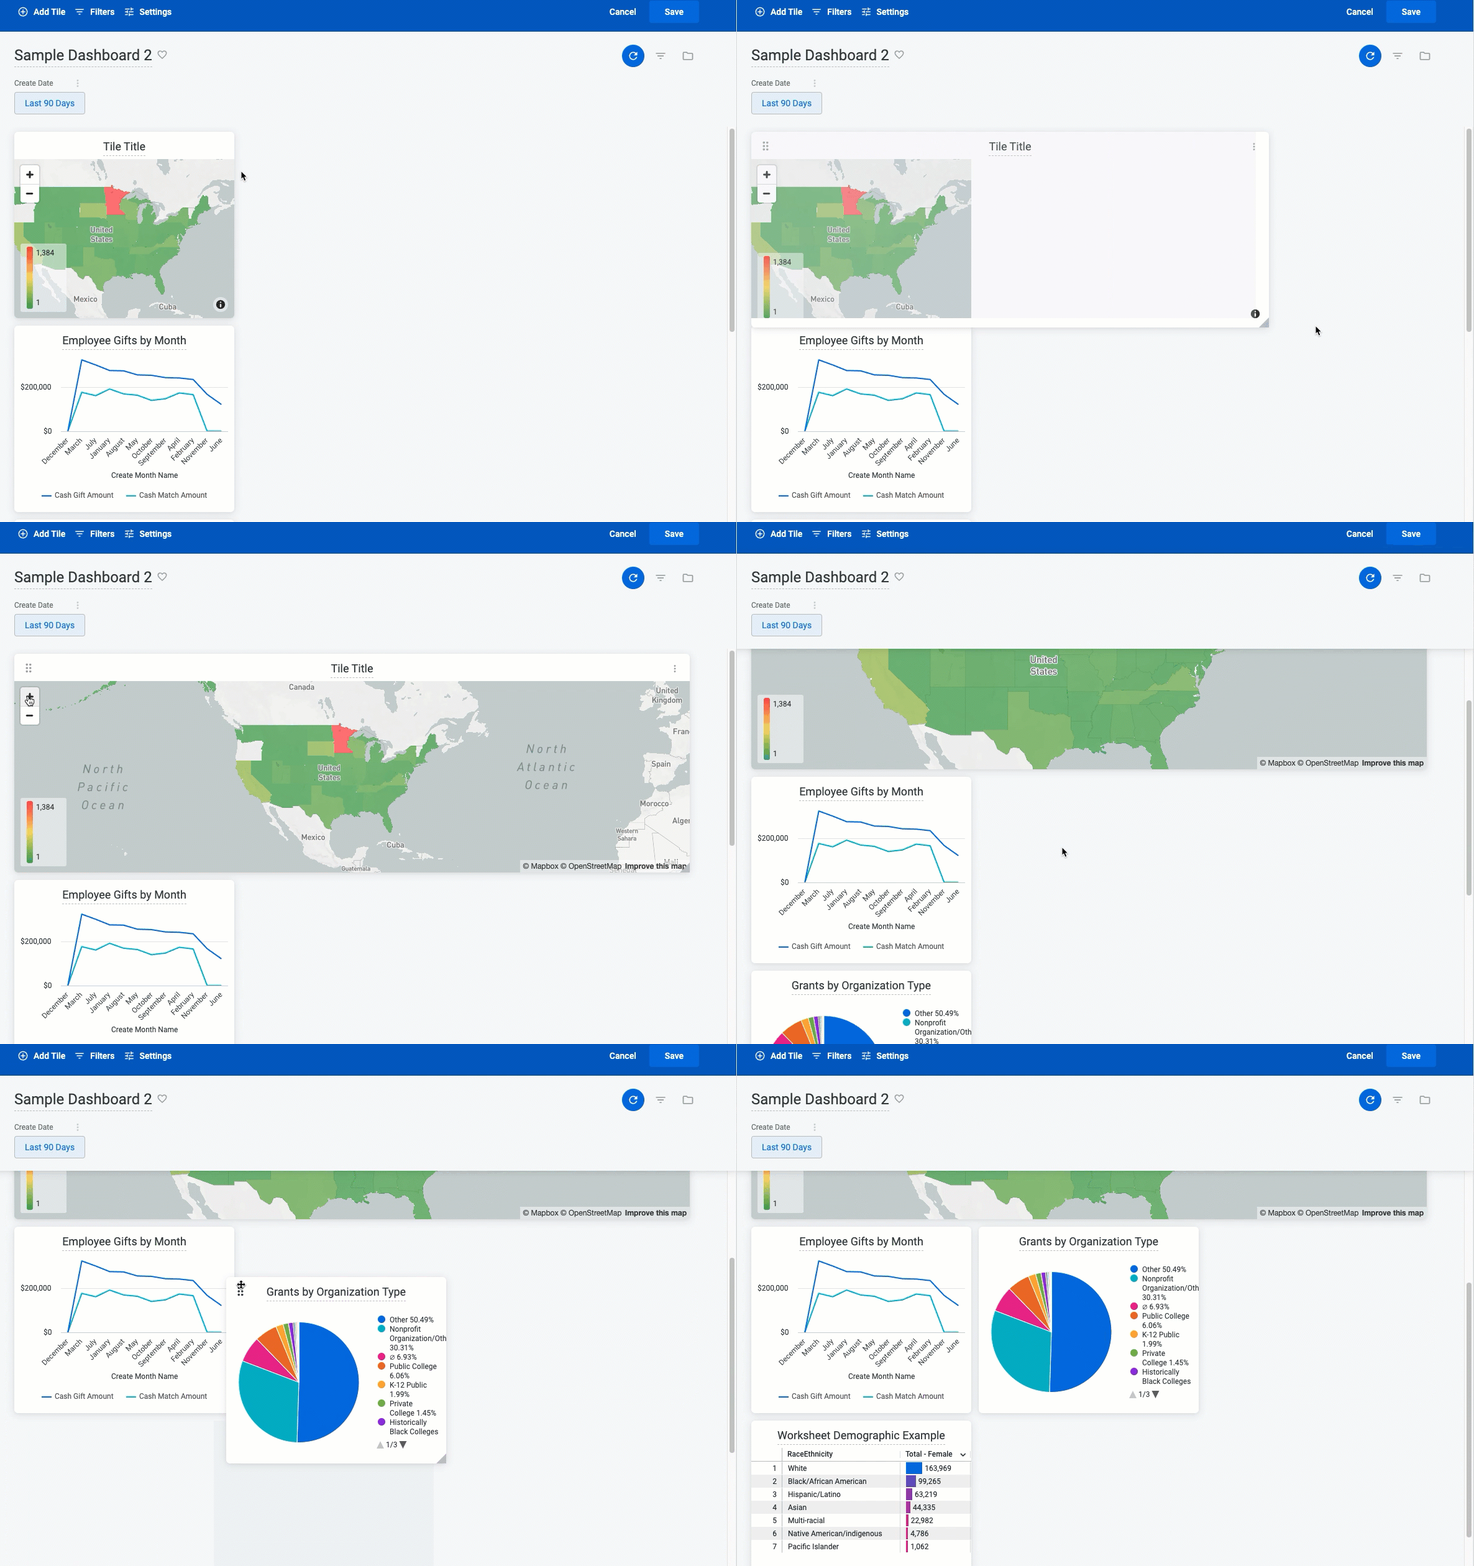
Any new tiles added to the Dashboard will be placed at the bottom of the existing layout, while all report tiles currently displayed can be resized and rearranged to fit nicely within your customized dashboard.
- Resize Tiles - To make a tile larger or smaller, click and drag the triangle from the bottom right corner of the tile.
- Arrange Tile Order - To change the order in which your tiles appear, simply click the 6-dot menu in the top left of the tile and drag it to your desired location.
Step 4: Apply Quick Layout
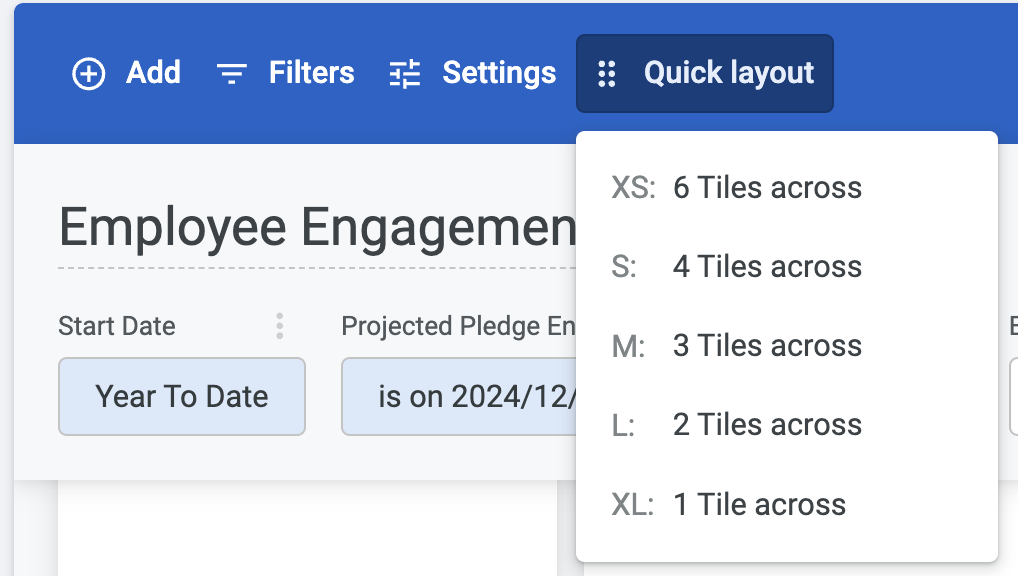
You also have the option to select a pre-defined layout grid from the Quick Layout option in the blue edit toolbar, which will set all tiles to the same size.
- NOTE: The Quick Layout feature affects all tiles, including text tiles, visualization tiles, Markdown tiles, and buttons.
The five options for tile size are as follows:
- XS - Six tiles fit in a row on the dashboard.
-
S - Four tiles fit in a row on the dashboard.
-
M - Three tiles fit in a row on the dashboard.
-
L - Two tiles fit in a row on the dashboard.
-
XL - One tile fits in a row on the dashboard.
What else do you need help with?
Not what you're looking for? Navigate to Create an Insights Dashboard Overview


