Insights Analysts have the ability to customize the data table within an Explore to suit their specific analysis needs. By adding or rearranging fields, sorting data, and adjusting visibility, analysts can effectively manipulate the data table to uncover valuable patterns and trends.
Proceed as follows to customize the data table in an Insights Explore.
Step 1: Access the Insights tab
Log in to the CyberGrants platform and navigate to the Insights tab.

Step 2: Choose an Explore
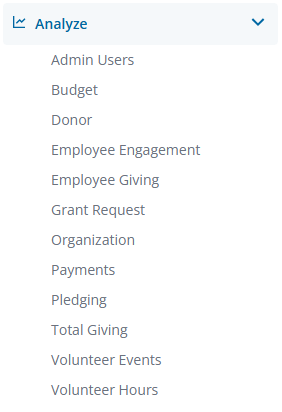
From the left-hand menu, Insights Analysts can click on Analyze to view the available Explores. Select the Explore that best aligns with your data analysis objectives.
Step 3: Create a Data Table
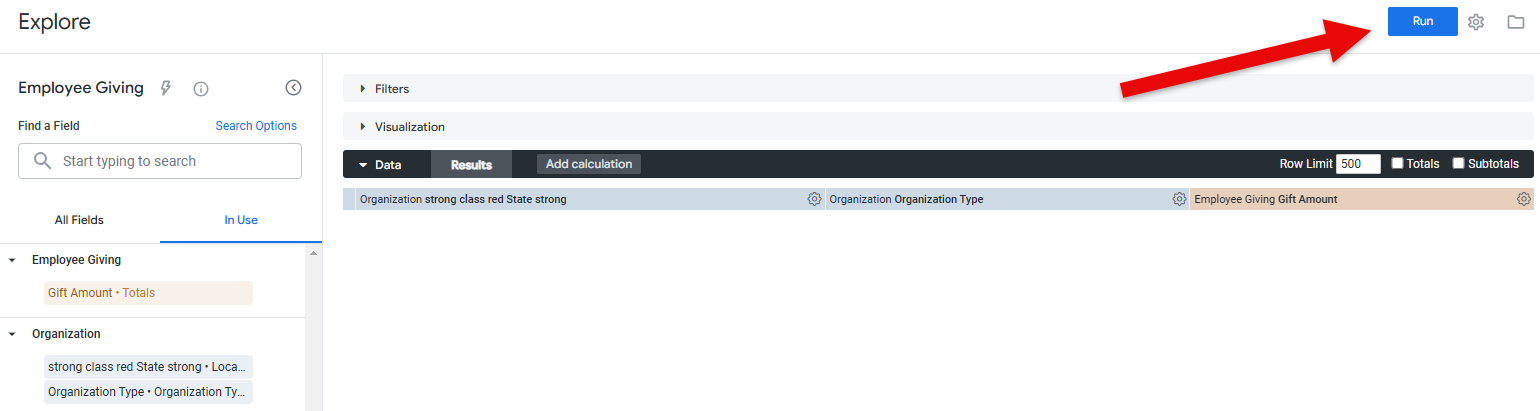
Customize your data set by adding field dimensions or measures as needed, then click "Run" to populate the values in the data table.
Step 4: Rearrange Data Fields
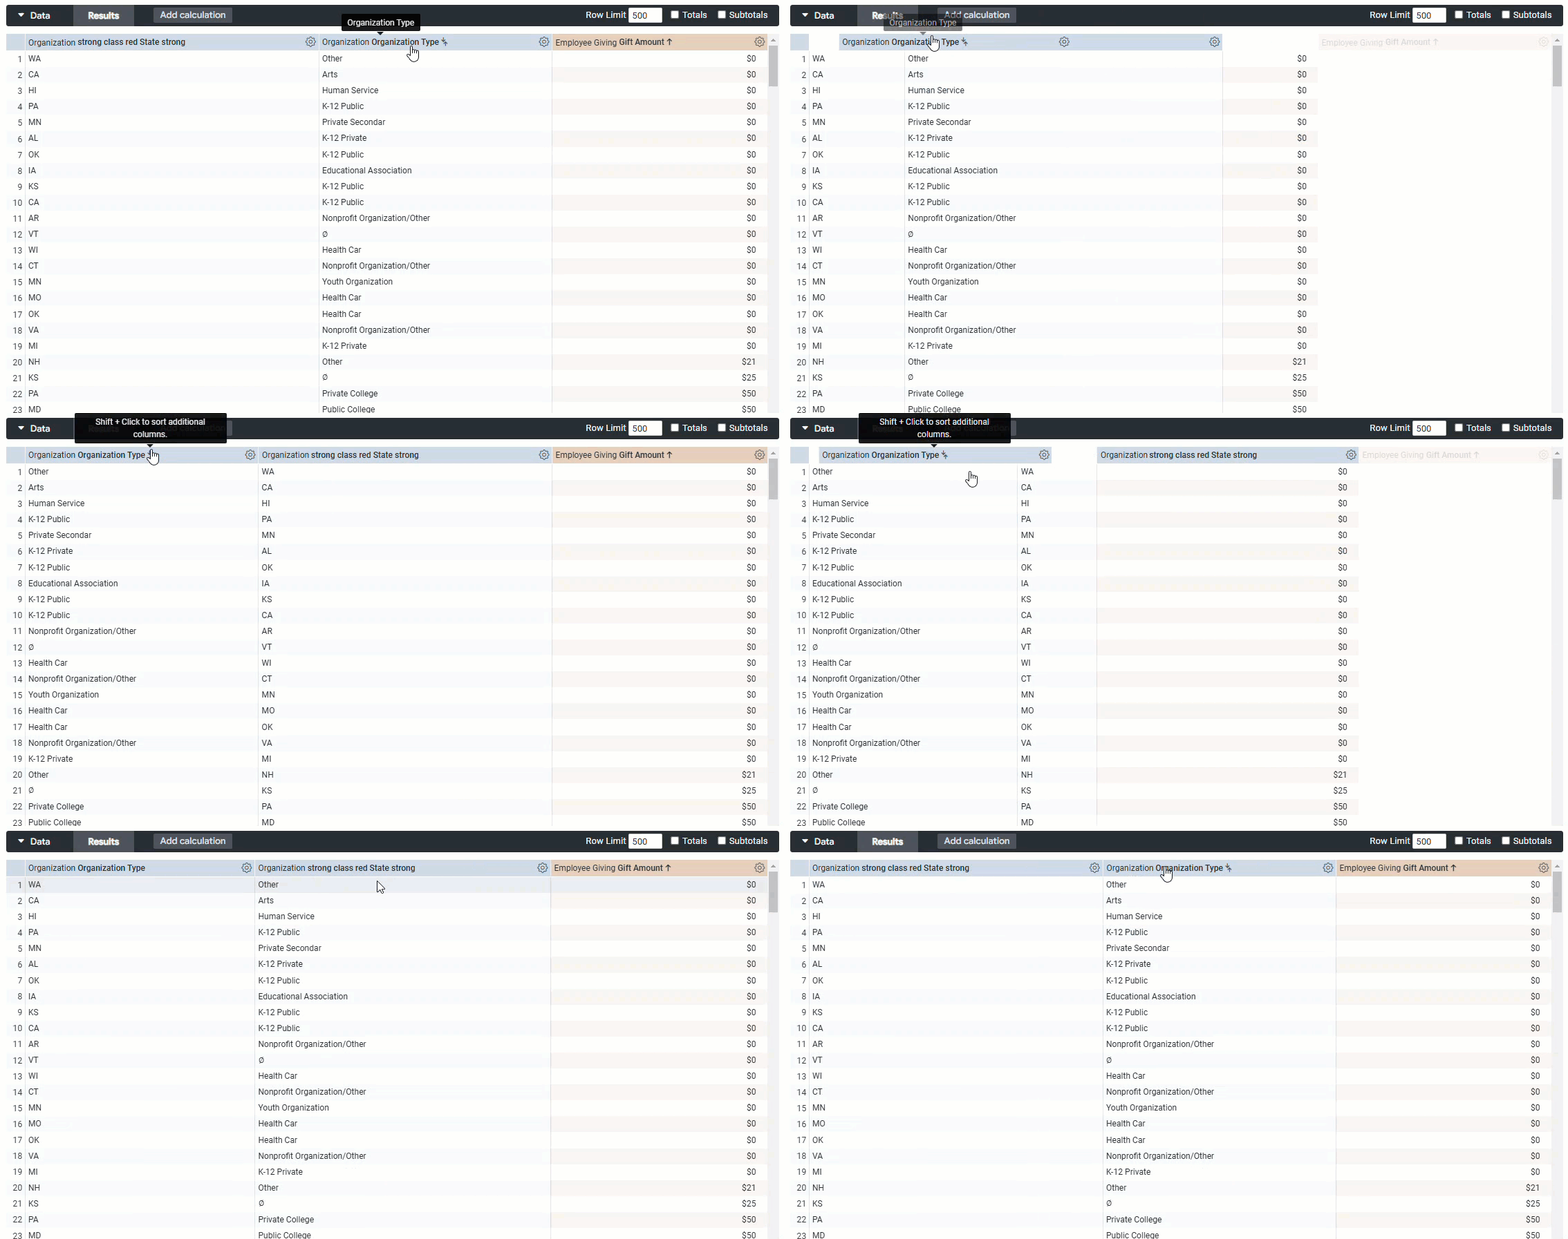
Drag and drop the desired data fields into your preferred order within the data table.
- NOTE: Measure fields must remain in the right section of the data table.
Step 5: Sort Data by Field
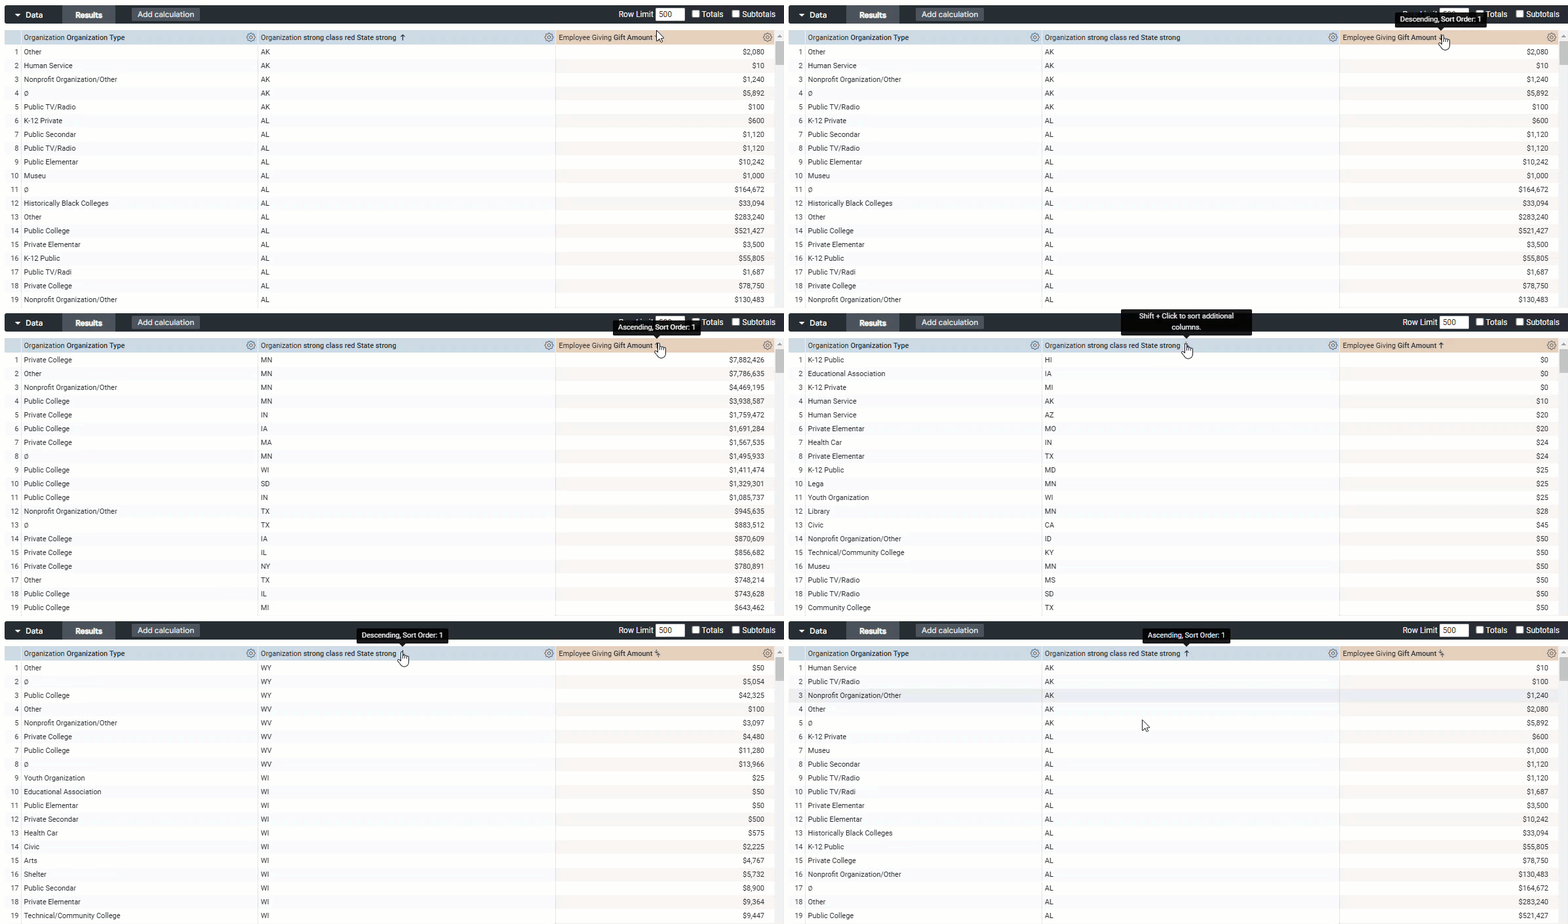
Click the arrow next to a field name to sort the data set in ascending or descending order.
Step 6: Customize Field Interactions
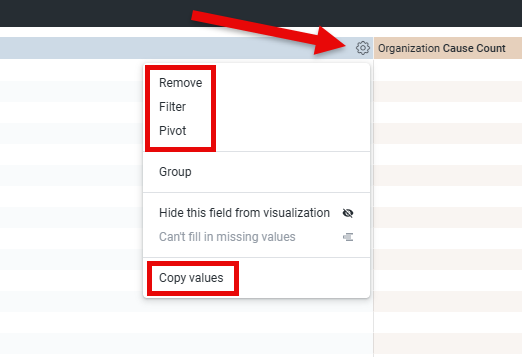
Click the gear icon next to a field to remove, filter by, or pivot on that field.
- Also, from the gear icon, select "Copy Values" to copy all yielded values within that field column.
Step 7: Adjust Data Visibility
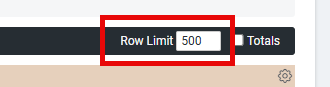
Modify the Row Limit to display more or fewer data records as needed.
- NOTE: The row limit typically defaults to 500 records, but can be expanded to a maximum of 5,000 records.
Step 8: Enable Totals
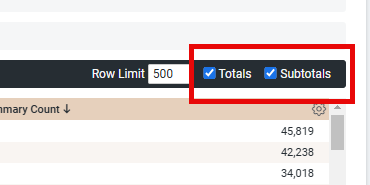
Select the "Totals" checkbox to display a Totals row at the bottom of the data set.
If your report contains multiple dimensions, you can choose to include Subtotals in your table visualization.
What else do you need help with?
Not what you're looking for? Return to Navigating Insights Explores Basics or access the Insights Analyze Basics Overview


