To get started using an Explore, Insights Analysts first access the Analyze section and, from there, they can select an Explore that aligns with their analytical needs. Once in the main Explore workspace, Analysts can leverage the Quick Start analyses available, which provide a solid foundation for their investigations, or use data fields that include dimensions and measures enabling them to create powerful data visualizations.
Proceed through the following steps to access an Explore and view the data fields available within the Explore's main workspace.
Step 1: Access the Insights tab
Log in to the CyberGrants platform and navigate to the Insights tab.

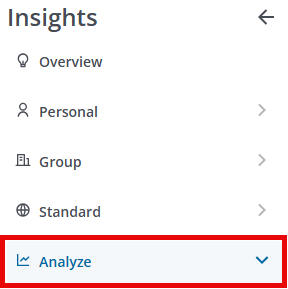
Step 2: Click on Analyze
From the left-hand menu, Insights Analysts can click on Analyze to view the available Explores.
Step 3: Select an Explore to view the Main Workspace
Once you have expanded the "Analyze" section in the left-hand menu, you can select an Explore to begin your investigation. This will take you to the main Explore workspace, where you can access the available data and analytical tools.
(i.e.) Payments Explore workspace:
Step 4: Leverage the Quick Start Analyses
When you first enter an Explore, you will often find a Quick Start section, which contains one or more pre-built reports. These Quick View analyses provide Insights Analysts with a solid foundation to begin their investigations, saving time and ensuring consistency in their analytical approaches.
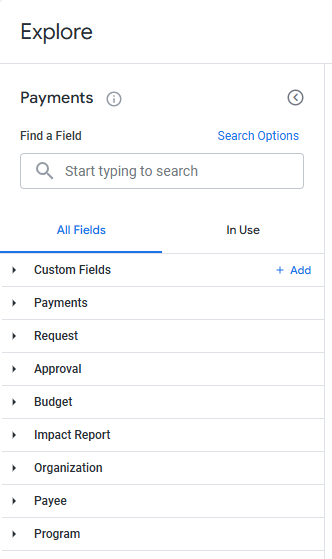
Step 5: Understand the Available Fields
The fields available within each Explore may vary, as they are tailored to the specific data and analyses relevant to that Explore.
(i.e.) Payments Explore data fields:
Step 6: Explore the Dimensions and Measures
The data shown in an Explore is determined by the dimensions and measures you select from the field picker to the left. By selecting the appropriate dimensions and measures from the field picker, you can create powerful data visualizations. As fields are selected, they will appear under the "In Use" column.
- Dimensions can be thought of as a group or bucket of data.
- Measures are information about that bucket of data, typically a calculation of some kind (Count, Average, Total, etc).
(i.e.) Payments Explore Dimensions and Measures:
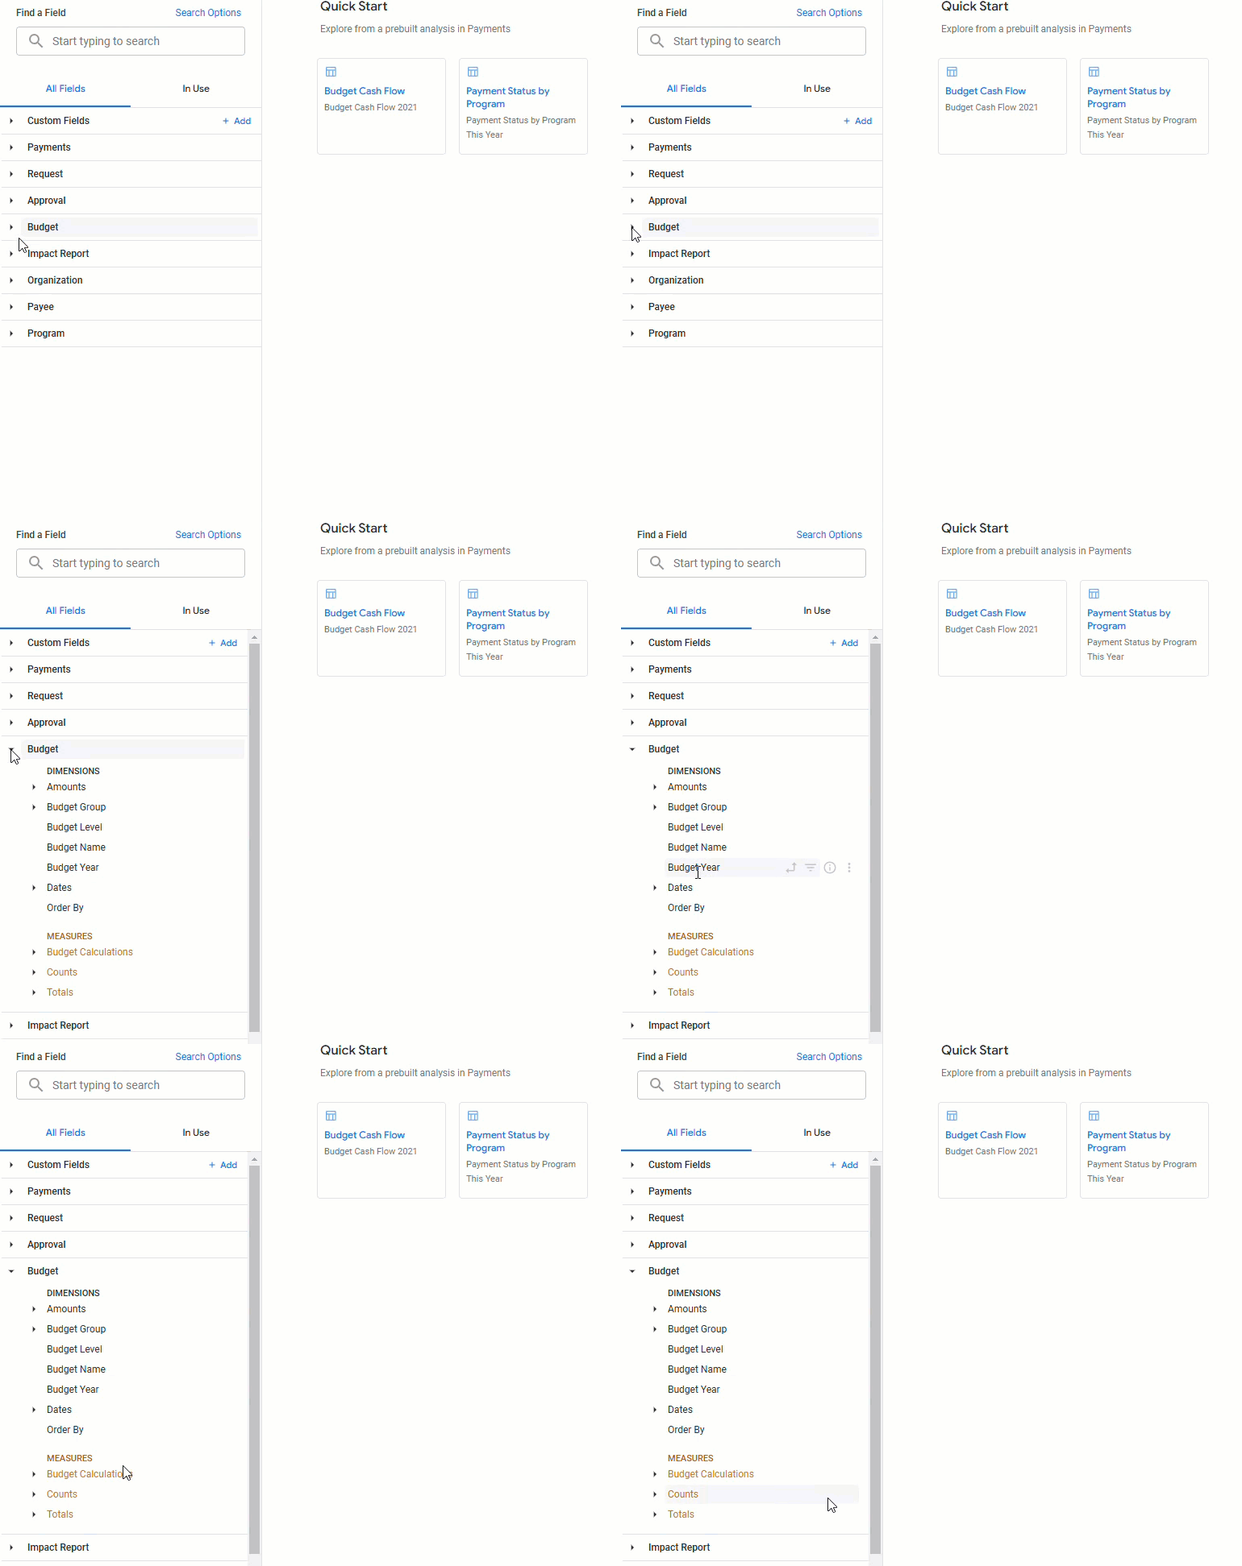
In Insights, dimensions appear as blue columns and measures appear as orange columns within your data table.

What else do you need help with?
Not what you're looking for? Return to Navigating Insights Explores Basics or access the Insights Analyze Basics Overview


