This article explains how to create a Participation by Department report using the Donor Explore in Insights. This report helps customers understand how many active employees exist within each department, how many participated in a program during a given year, and what percentage of each department participated overall.
The following steps will guide you through the process, from initial setup through saving and visualizing your report.
Step 1: Access the Donor Explore in Insights
Begin by navigating to the admin view of CyberGrants.
Once signed in, select Insights from the omni bar. In Insights, select Analyze from the left-hand navigation, then choose the Donor explore.
If needed, collapse the left-hand sidebar using the arrow icon to provide a wider workspace view.
Step 2: Add Employee Population data
Within the Donor Explore, use the Find a Field option to search for Employee Population.
Click the field name to add it to the Data region. Then click Run in the top-right corner to view the overall Employee Population total. This initial result includes both active and inactive donor records and is unfiltered.
Step 3: Break down results by department
To divide the employee population by department, use Find a Field to search for the Department field under Donor fields.
Select the field and click Run again. The report now displays the number of donors per department. At this stage, the results may include a null department value, representing employees without an assigned department.
Step 4: Exclude employees without a department
To remove employees who do not have a department assigned, apply a filter to the Department field.
Select the Filter icon next to Department, or use the gear icon in the Department column header and select Filter. In the Filter region, open the qualifier dropdown and select is not null. Click Run to refresh the report and remove the null department records.
Step 5: Create a filtered measure for program participants
To show how many active employees participated in a program during the year, create a filtered measure based on Employee Population.
You can do this by selecting the gear icon on the Employee Population column in the Data region, or by clearing the Find a Field search, opening the In Use tab, selecting the three-dot menu next to Employee Population, and choosing Create filtered measure.
In the filtered measure dialog:
- Enter a name for the column, such as Participants this Year.
- Add a filter for Program where the value is not null.
- Add a filter for Disposition – Gifts, set to is not canceled or rejected.
- Add a filter for Start Year, set to this year.
Click Save, then click Run to view the updated results. You can now compare total active employees to participating employees by department.
Step 6: Calculate percent participation by department
To calculate participation as a percentage, select Add Calculation in the Data region to open the custom expression window.
In the Expression field, create a calculation by dividing Participants this Year by Employee Population. Use the auto-complete options for column names when available.
Name the calculation, such as % Participation. Set the Format to Percent and choose the desired number of decimal places.
Click Save to add the calculated column to your report.
Step 7: Format and enhance the table visualization
To improve readability, minimize the Filters and Data sections, and expand the Visualization section.
Select the Table visualization. Click Edit, then open the Formatting tab. Enable Conditional Formatting, change numeric field selection to Select fields, and choose the % Participation column.
Ensure that the Mirror range around center value is disabled and the numeric ranges are set appropriately for percentages. You may also adjust the color palette as needed. Close the formatting panel when finished.
Step 8: Sort and save the report
Click the % Participation column header to sort results by participation rate.
To save the report, select the gear icon in the top-right corner and choose Save. Select As a Look, choose My folder or a Group folder, enter a title, and click Save.
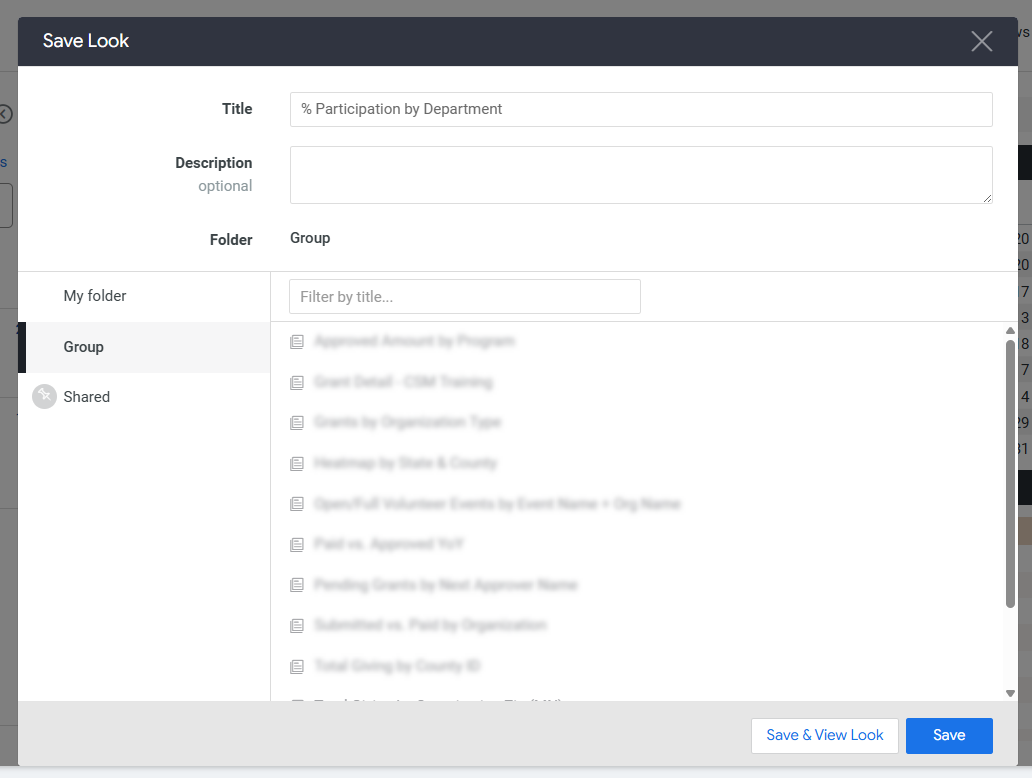
After the page reloads, the saved report appears in the sidebar navigation under Group > Reports.
To further expand your reporting skills, review Help Center articles on advanced Insights techniques or reach out to your program administrator for guidance on reporting best practices.
What else do you need help with?
Not what you're looking for? Navigate to Understanding Insights Reports
Looking for training?
Explore this feature at your own pace - access training video content or watch a recorded webinar by clicking the link below.


