Need a faster way to organize your data? The video below gives you a quick demo of creating custom groups in Insights.
Insights Analysts often need to create custom groupings of data to gain a deeper understanding of their program's data. The Group custom field type in an Insights Explore allows analysts to easily create ad hoc custom groups for both standard and custom dimensions, without the need to use logical functions in expressions or develop CASE WHEN logic in SQL parameters. This can be particularly helpful when analysts want to assign fixed labels or category names to values that match specific conditions, such as grouping states or countries into regions.
Proceed through the following instructions to complete the process of creating custom groups in an Insights Explore.
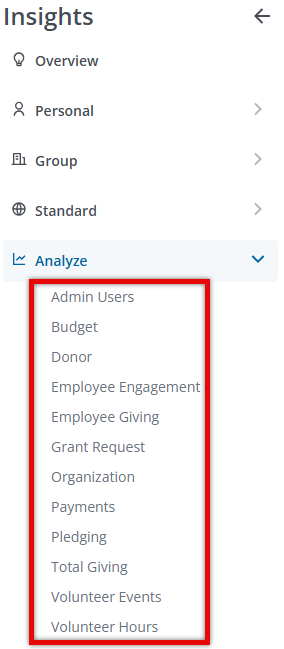
Step 1: Access Insights and Choose an Explore
Log into CyberGrants and navigate to the Insights platform.

Then, select the desired Explore to begin your analysis.
Step 2: Access the Group Function
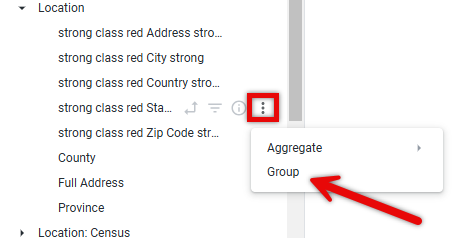
You can create a Group in one of two ways:
- From the field picker on the left-hand side of the Insights Explore interface, locate the folder that contains the dimension for which you want to create custom groups. Click the vertical ellipsis menu next to the field dimension and select "Group" from the dropdown menu.
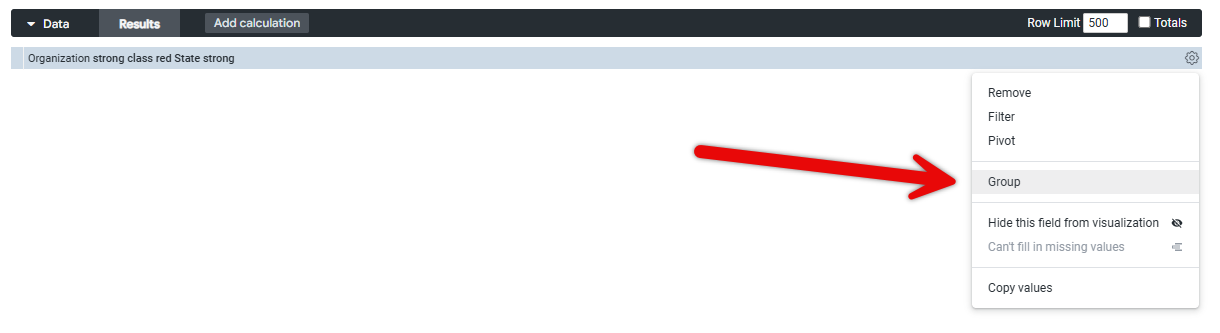
- Alternatively, if the field dimension is already selected in your Explore data table, you can click the gear menu next to the dimension name and select "Group" from the options.
Step 3: Specify the Group Name
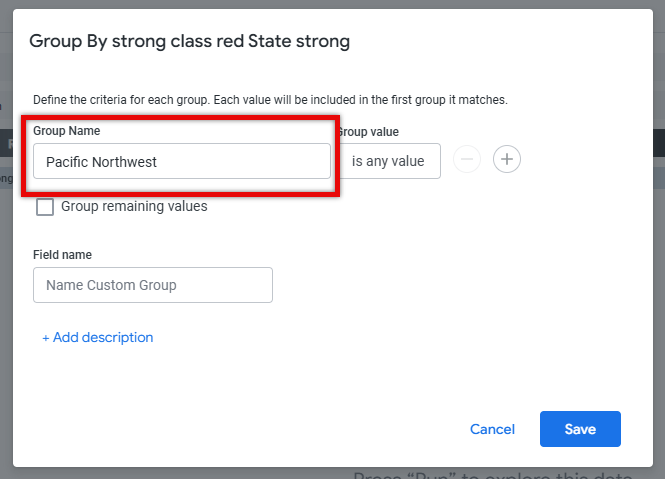
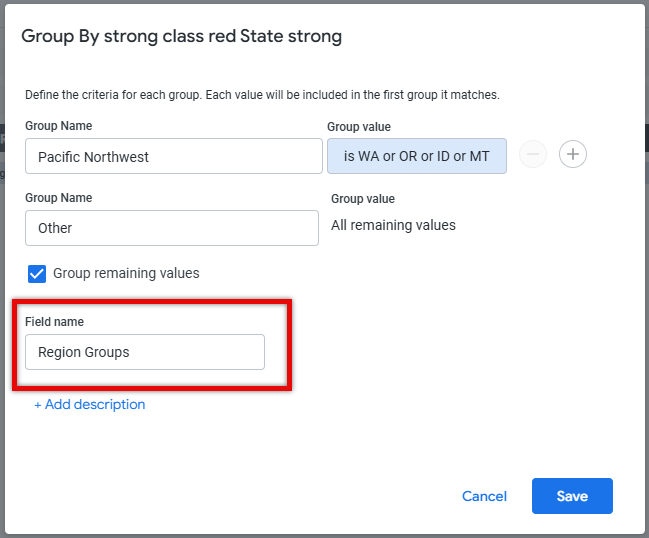
Once the Group modal appears, the first step is to specify a label for the custom group you are creating.
- In this example, we are creating a group of states for the Pacific Northwest region of the United States, so we might label the first group as "Pacific Northwest".
Step 4: Define the Group Conditions
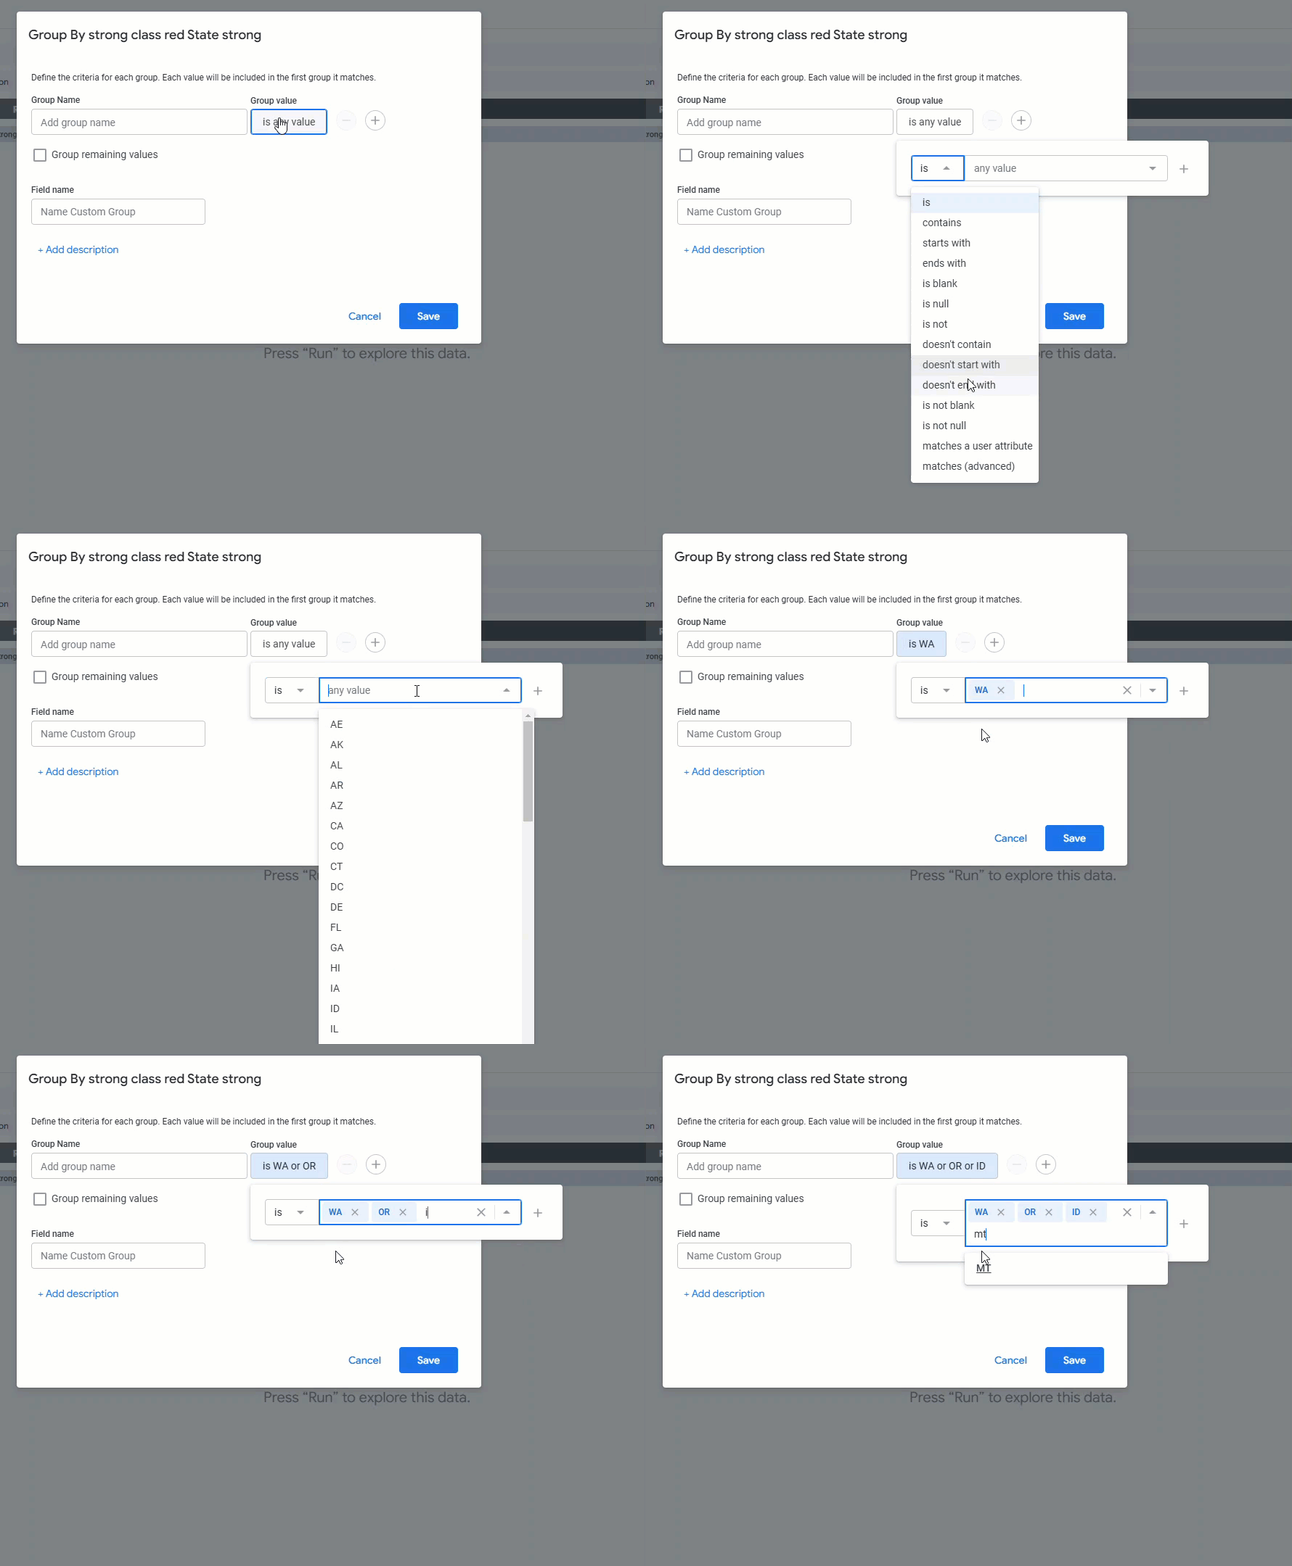
Select a condition, and enter or select one or more values. Click the plus sign (+) next to the value to add multiple conditions for the selected field, or click outside of the filter condition settings to save.
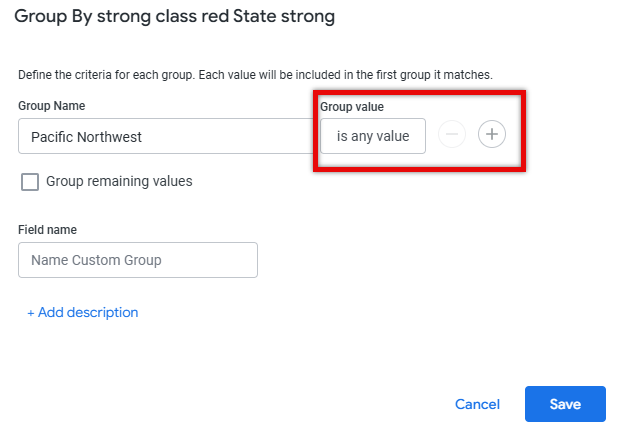
Click the default "is any value" filter condition to open the condition selection menu for your group. Here, you can choose from a variety of condition types, such as "is", "is not", "contains", "does not contain", and more, depending on the data type of the dimension you are grouping.
- In the below example, since we are grouping states in the United States, we would select the "is" condition and then enter or select the specific states that make up the Pacific Northwest region (e.g., Washington, Oregon, Idaho, Montana).
Step 5: Add Additional Groups
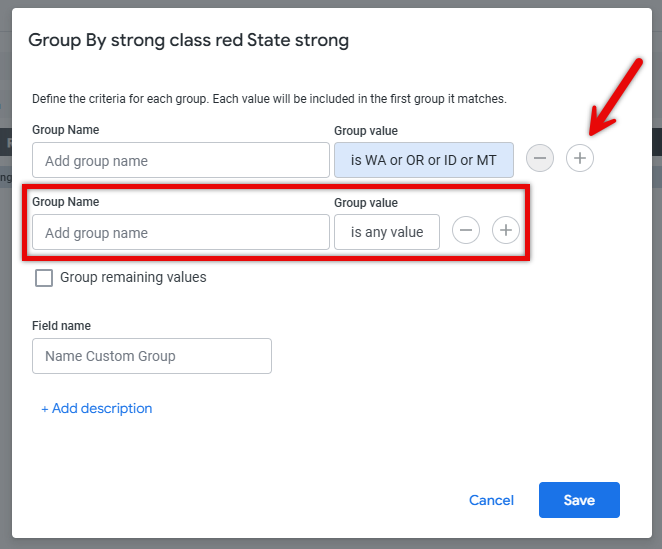
If you need to create more than one custom group for the field dimension, hover over the existing group and click the (+) button that appears. This will allow you to define a new group with its own label and conditions. To remove a group, click the (-) button next to the group you want to delete.
- NOTE: Insights automatically applies SQL conditions such as AND or OR logic when multiple conditions or groups are created, based on the field types, conditions, and values that you specify.
Step 6: Group Remaining Values
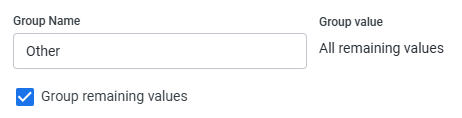
If there are any values for the dimension that do not match the conditions defined in your custom groups, you can choose to create a "Group remaining values" category. This will capture all unmatched values under a single group, which can be helpful for ensuring complete coverage of your data. The default name for this group is "Other", but you can customize it as needed.
Step 7: Name the Custom Field
Specify a name for the custom field to represent your custom groups, which will appear in both the field picker and the data table. The default name for custom groups is Dimension_Name Groups.
Step 8: Add a Description
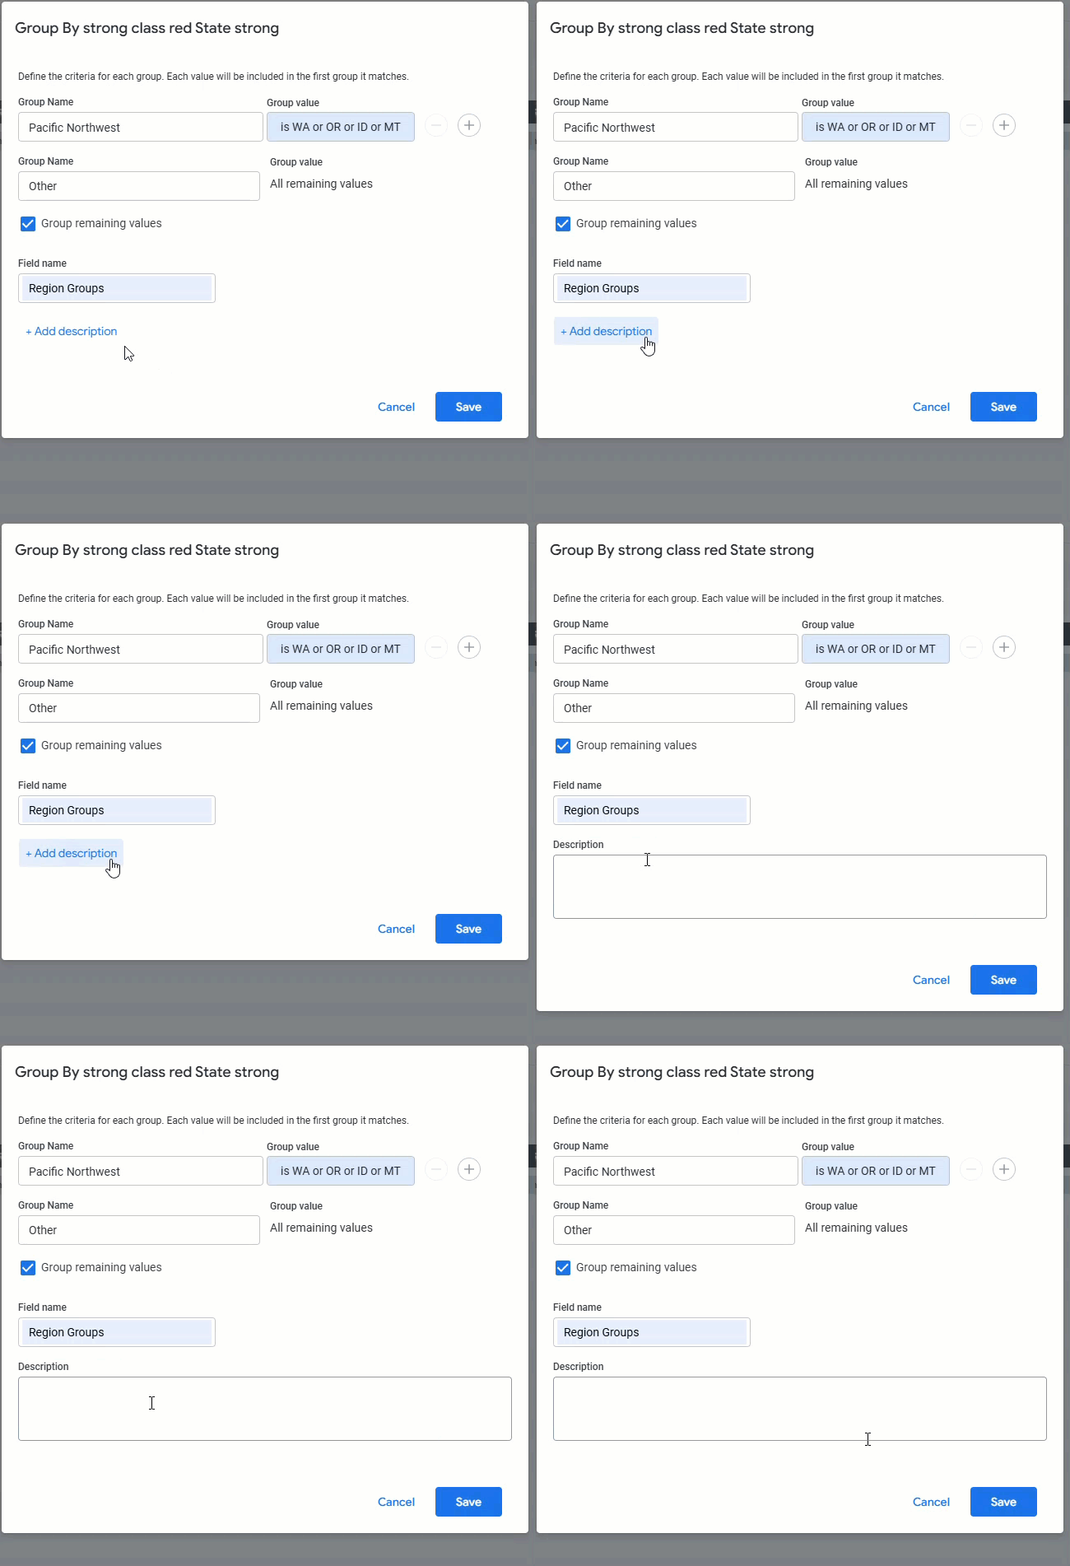
Click the "+ Add Description" button to provide an optional description of up to 255 characters for the custom field. This can help other users understand the purpose and contents of the custom group.
Step 9: Save and View the Custom Group
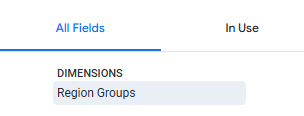
Once you have completed all the necessary steps, click the "Save" button to create the custom group. You can then use the new group field to make new observations about your data. The new field will appear in the Custom Fields section of the left field picker, where you can click the field's name to add or remove it from your data table. You can also add your new field as a Filter or include it in a visualization as needed.
- NOTE: You cannot use custom fields to create dashboard filters.
What else do you need help with?
Not what you're looking for? Navigate to Understanding Insights Custom Fields


