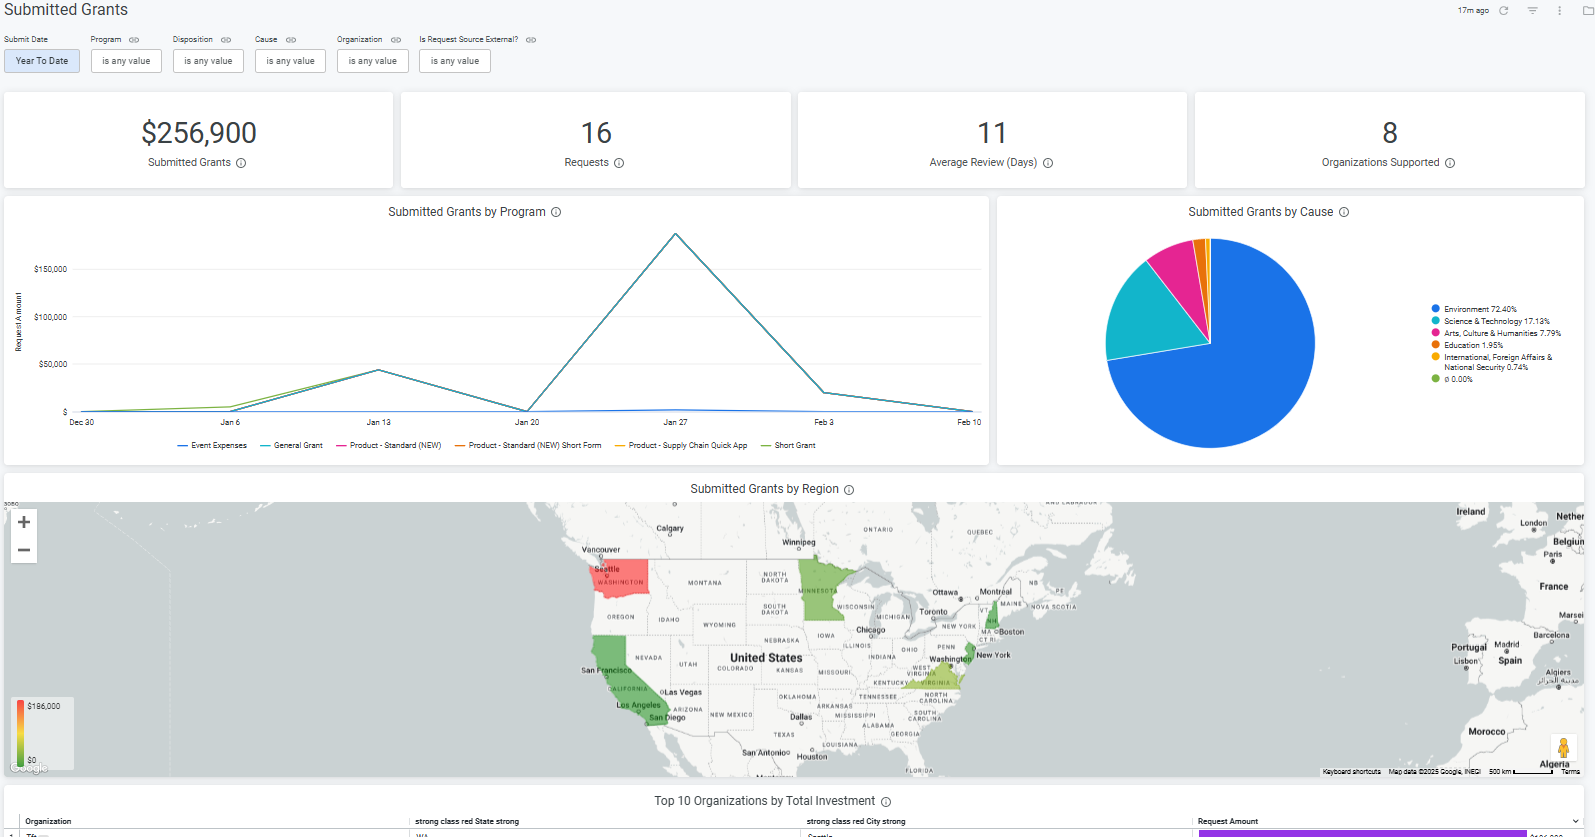
The Submitted Grants dashboard provides an overview of Submitted Grants across all status (disposition) types, including Total Requested Grant Amount, Total # Requests, and Average # of Days to Review a Request.
- Administrators can also view details about the Total # of Organizations, Total Requested Grant Amount by Cause & Location, and Top 10 Organizations by Grant Request Amount.
Target Audience: Program Administrators & Program Coordinators
Proceed as follows to further explore the Submitted Grants standard dashboard and its features.
Step 1: Access the Dashboard
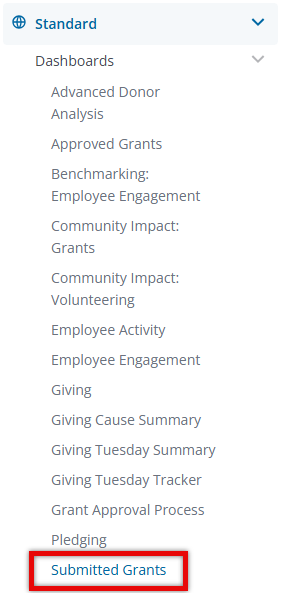
Navigate to the Insights platform and choose Submitted Grants from the list of Standard Dashboards in the left-side navigation panel.
Step 2: Explore the Dashboard Reports
The following is a list of reports included in the Submitted Grants standard dashboard.
Report Name
|
Description
|
| Submitted Grants | Sum of the Grant Requested Amounts. |
| Requests | Unique count of requests. |
| Average Review (Days) | Average Days from the Submission Date to the Final Approval Date. |
| Organizations Supported | Unique Count of Non-Profits who requested grants. |
| Submitted Grants by Program | Total Requested Grant Amounts by Program Type. |
| Submitted Grants by Cause | Total Requested Grant Amounts by Cause. |
| Submitted Grants by Region | Total Requested Grant Amounts by State. |
| Top 10 Organizations by Total Investment | Total Requested Grant Amounts Sorted from Highest to Lowest by Organization and Filtered to Top 10 of Highest Requested. |
Step 3: Use the Dashboard Filters
Insights users can utilize the following filters to adjust their view of the data displayed across all tiles within this dashboard.
- Submit Date
- Program
- Disposition
- Cause
- Organization
- Is Request Source External?
What else do you need help with?
Not what you're looking for? Navigate to Insights Standard Dashboards Overview


