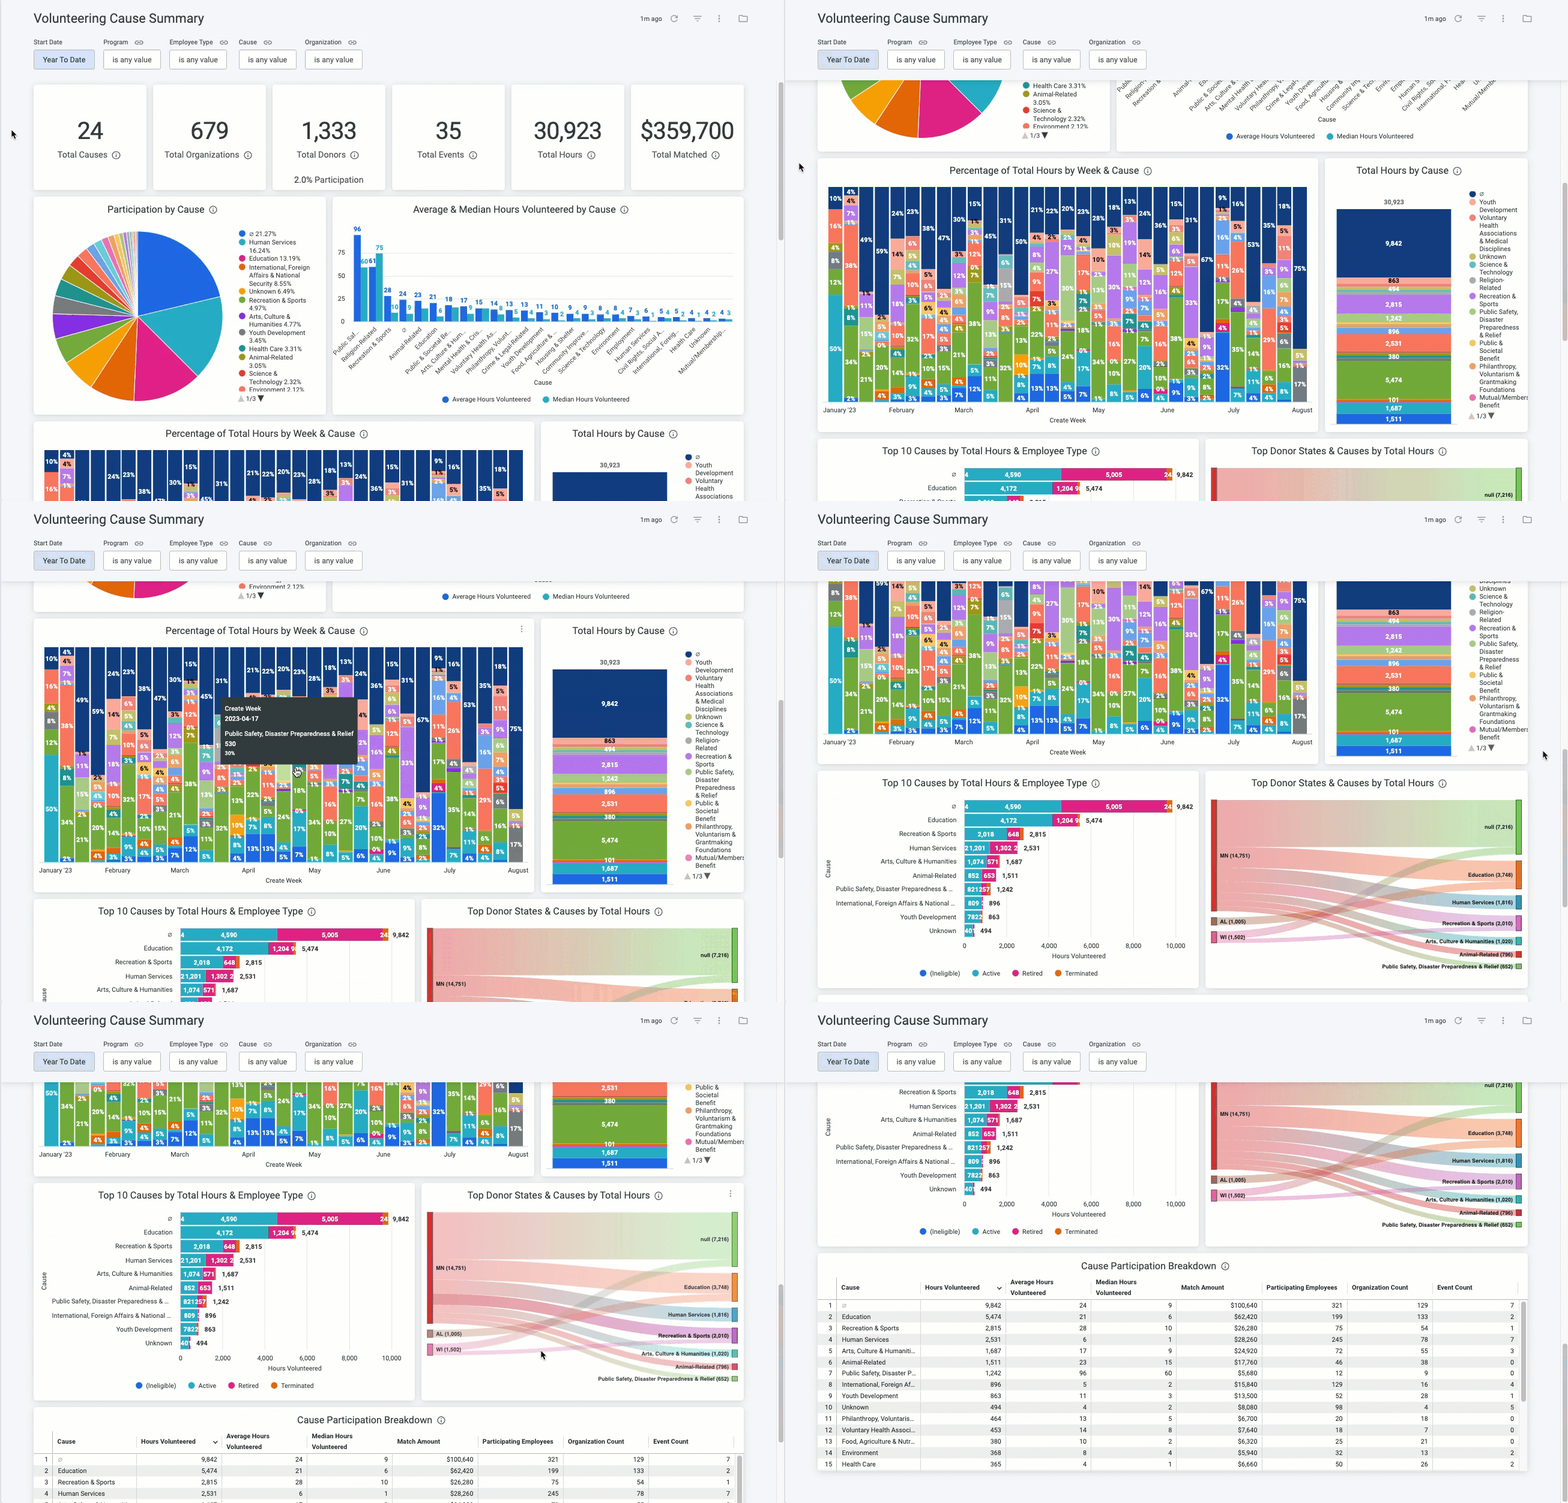
The Volunteering Cause Summary standard dashboard provides an overview of how donors are volunteering across the various available Causes, indicating where Cause participation might align or differ from the company's primary focus areas.
This dashboard includes metrics such as Top Cause Participation by Donor Count/Donor State/Employee Type, Top 10 Causes by Hours Volunteered, and Total Hours by Cause.
Target Audience: Program Administrators & Program Coordinators
Proceed as follows to further explore the Volunteering Cause Summary standard dashboard and its features.
Step 1: Access the Dashboard
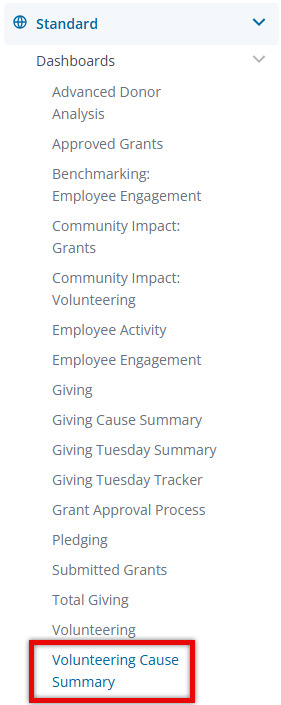
Navigate to the Insights platform and choose Volunteering Cause Summary from the list of Standard Dashboards in the left-side navigation panel.
Step 2: Explore the Dashboard Reports
The following is a list of reports included in the Volunteering Cause Summary standard dashboard.
Report Name
|
Description
|
| Total Causes | Unique count of Causes to which hours (not in disposition Canceled or Rejected) were volunteered. |
| Total Organizations | Unique count of Non-Profits with whom hours (not in disposition Canceled or Rejected) were volunteered. |
| Total Donors | Unique donor count (both active/inactive) not in disposition Canceled or Rejected. |
| Total Events | Unique count of events to which hours (not in disposition Canceled or Rejected) were volunteered. |
| Total Hours | Sum of total volunteer hours not in disposition Canceled or Rejected. |
| Total Matched | Total match amount not in disposition Canceled or Rejected. |
| Participation by Cause | Unique count of donors that volunteered to each Cause. This does not include any hours in disposition Canceled or Rejected. |
| Average & Median Hours Volunteered by Cause | Average & Median Hour count for each Cause. This does not include any hours in disposition Canceled or Rejected. |
| Percentage of Total Hours by Week & Cause | Percentage of total hours (not in disposition Canceled or Rejected) over a period of time by Create Week. If the Create Week began prior to the date range selected, the returned data will still only include the filtered dates. |
| Total Hours by Cause | Total hours not in disposition Canceled or Rejected by Cause. |
| Top 10 Causes by Total Hours & Employee Type | Total hours (not in disposition Canceled or Rejected) by Employee Type for the top 10 Causes. |
| Top Donor States & Causes by Total Hours | Top Donor States & Causes by total hours, excluding any hours in disposition Canceled or Rejected. |
| Cause Participation Breakdown | This does not include any hours in disposition Canceled or Rejected on the volunteer record. |
Step 3: Use the Dashboard Filters
Insights users can utilize the following filters to adjust their view of the data displayed across all tiles within this dashboard.


