The Employee Activity dashboard provides administrators with a profound level of analysis into donor activity across both Giving & Volunteering related to sessions and visitors, which fosters insight into activity trends and program engagement.
- Administrators are given access to actionable insights that identify general donor portal activity in near real-time, providing a clear view of user trends to aid predictive decision-making that will improve the user experience and support further visibility into program activity.
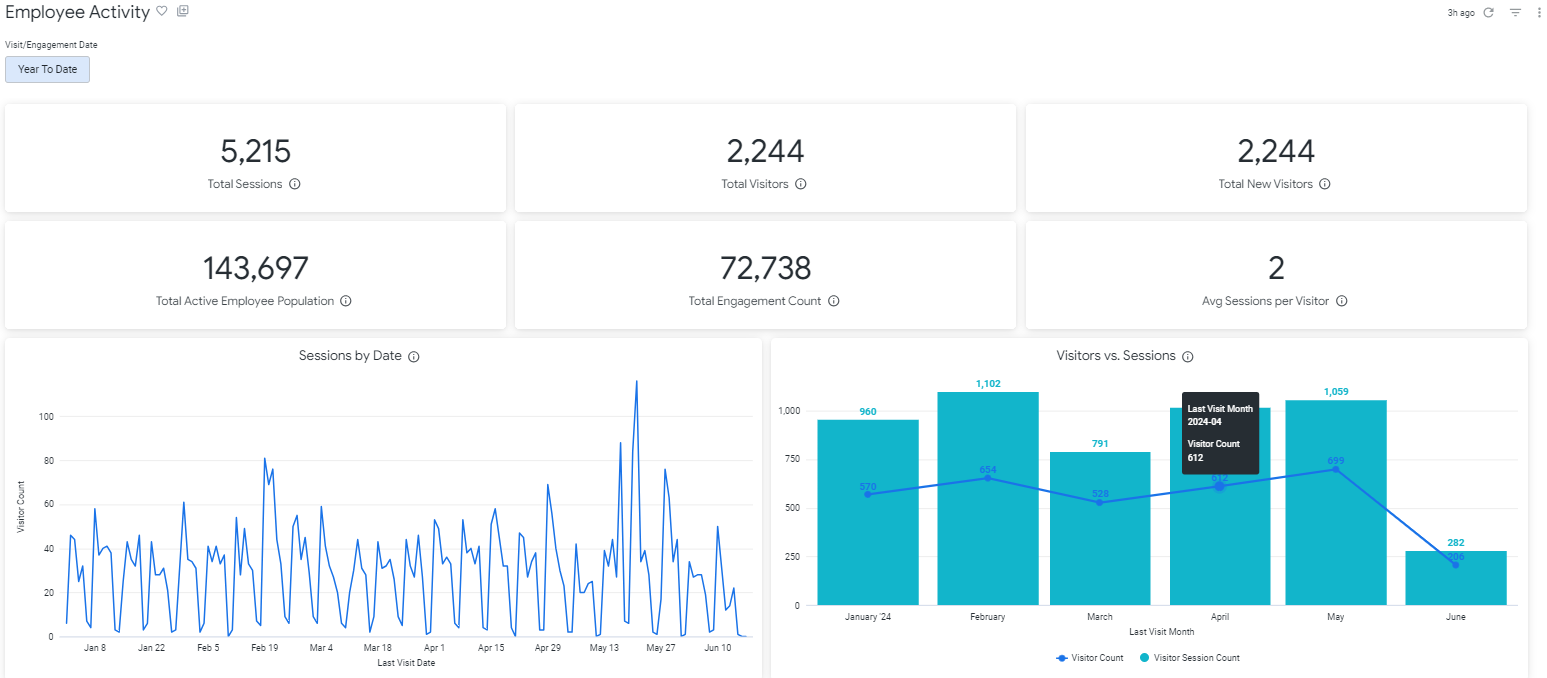
- This dashboard leverages our web analytics provider, Pendo, to include metrics that display the Total and Average Sessions per Visitor (including new visitors), the total Employee Population, an analysis of the Total Engagement Count by date, and a view of Visitors vs. Sessions.
NOTE: The Employee Activity Dashboard captures visitor activity as of October 2023.
Target Audience: Program Administrators & Program Coordinators
Proceed as follows to further explore the Employee Activity standard dashboard and its features.
Step 1: Access the Dashboard
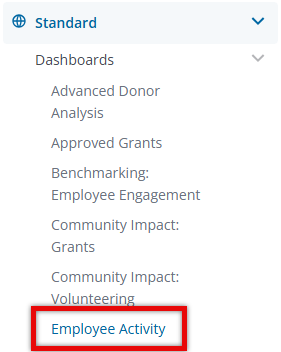
Navigate to the Insights platform and choose Employee Activity from the list of Standard Dashboards in the left-side navigation panel.
Step 2: Explore the Dashboard Reports
The following is a list of reports included in the Employee Activity standard dashboard.
Report Name
|
Description
|
| Total Sessions | The total number of sessions across all employees who have at least logged into the donor portal. |
| Total Visitors | The total count of unique employees who have at least logged into the donor portal. |
| Total New Visitors | The total count of unique employees who have had their first visit to the donor portal. |
| Total Active Employee Population | The total count of all unique active employees on the HR file. |
| Total Engagement Count | Total count of engagement records which include gifts, payroll deductions, and volunteer hours regardless of disposition. |
| Avg Sessions per Visitor | The average number of sessions for each employee who has at least logged into the donor portal. |
| Sessions by Date | The number of sessions by date. |
| Visitors vs Sessions | The number of visitors vs. sessions by month. |
| Visitors by State | The total count of unique employees who have at least logged into the donor portal by employee state. |
| Visitors by Operating System | The percentage breakdown of operating systems used across all visitors. |
| Visitors by Browser | The percentage breakdown of browsers used across all visitors. |
Step 3: View Fields used in the Dashboard
The following are some of the available fields on the dashboard.
- First Visit Date
- Last Visit Date
- Last Operating System
- Last Browser Name
- Visitor Count
- Visitor Session Count
- Standard Donor fields
Step 4: Use the Dashboard Filters
What else do you need help with?
Not what you're looking for? Navigate to Insights Standard Dashboards Overview


