The Community Impact: Grants dashboard offers a comprehensive solution to easily aggregate and visualize grantmaking data at the community level, revolutionizing how you measure and demonstrate your commitment to social responsibility.
Target Audience: Program Administrators & Program Coordinators in the Commercial Banking industry looking to report on grantmaking programs to better understand their community impact activities that influence LMI communities.
Key Benefits:
- Ensure accurate tracking with location-based fields. Say goodbye to manual data collection. Leverage census-based fields with geocoding, providing you with additional information on your CSR initiatives that may have influenced low- and moderate-income (LMI) communities.
- Streamline program data aggregation. Bring your data together in one system. Our dashboard seamlessly integrates with Bonterra’s Grants Management and Volunteerism solutions allowing you to effortlessly track your impact across various CSR initiatives, ensuring you have a comprehensive understanding of your community involvement.
- Foster a greater sense of transparency. Gain powerful insights through intuitive visualizations. Our dashboard presents your program data in an easy-to-understand format, enabling you to identify trends, measure progress, and communicate your impact effectively to your stakeholders.
Proceed as follows to further explore the Community Impact: Grants standard dashboard and its features.
Step 1: Access the Dashboard
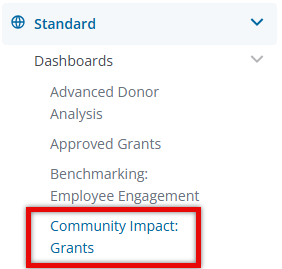
Navigate to the Insights platform and choose Community Impact: Grants from the list of Standard Dashboards in the left-side navigation panel.
Step 2: Explore the Dashboard Reports
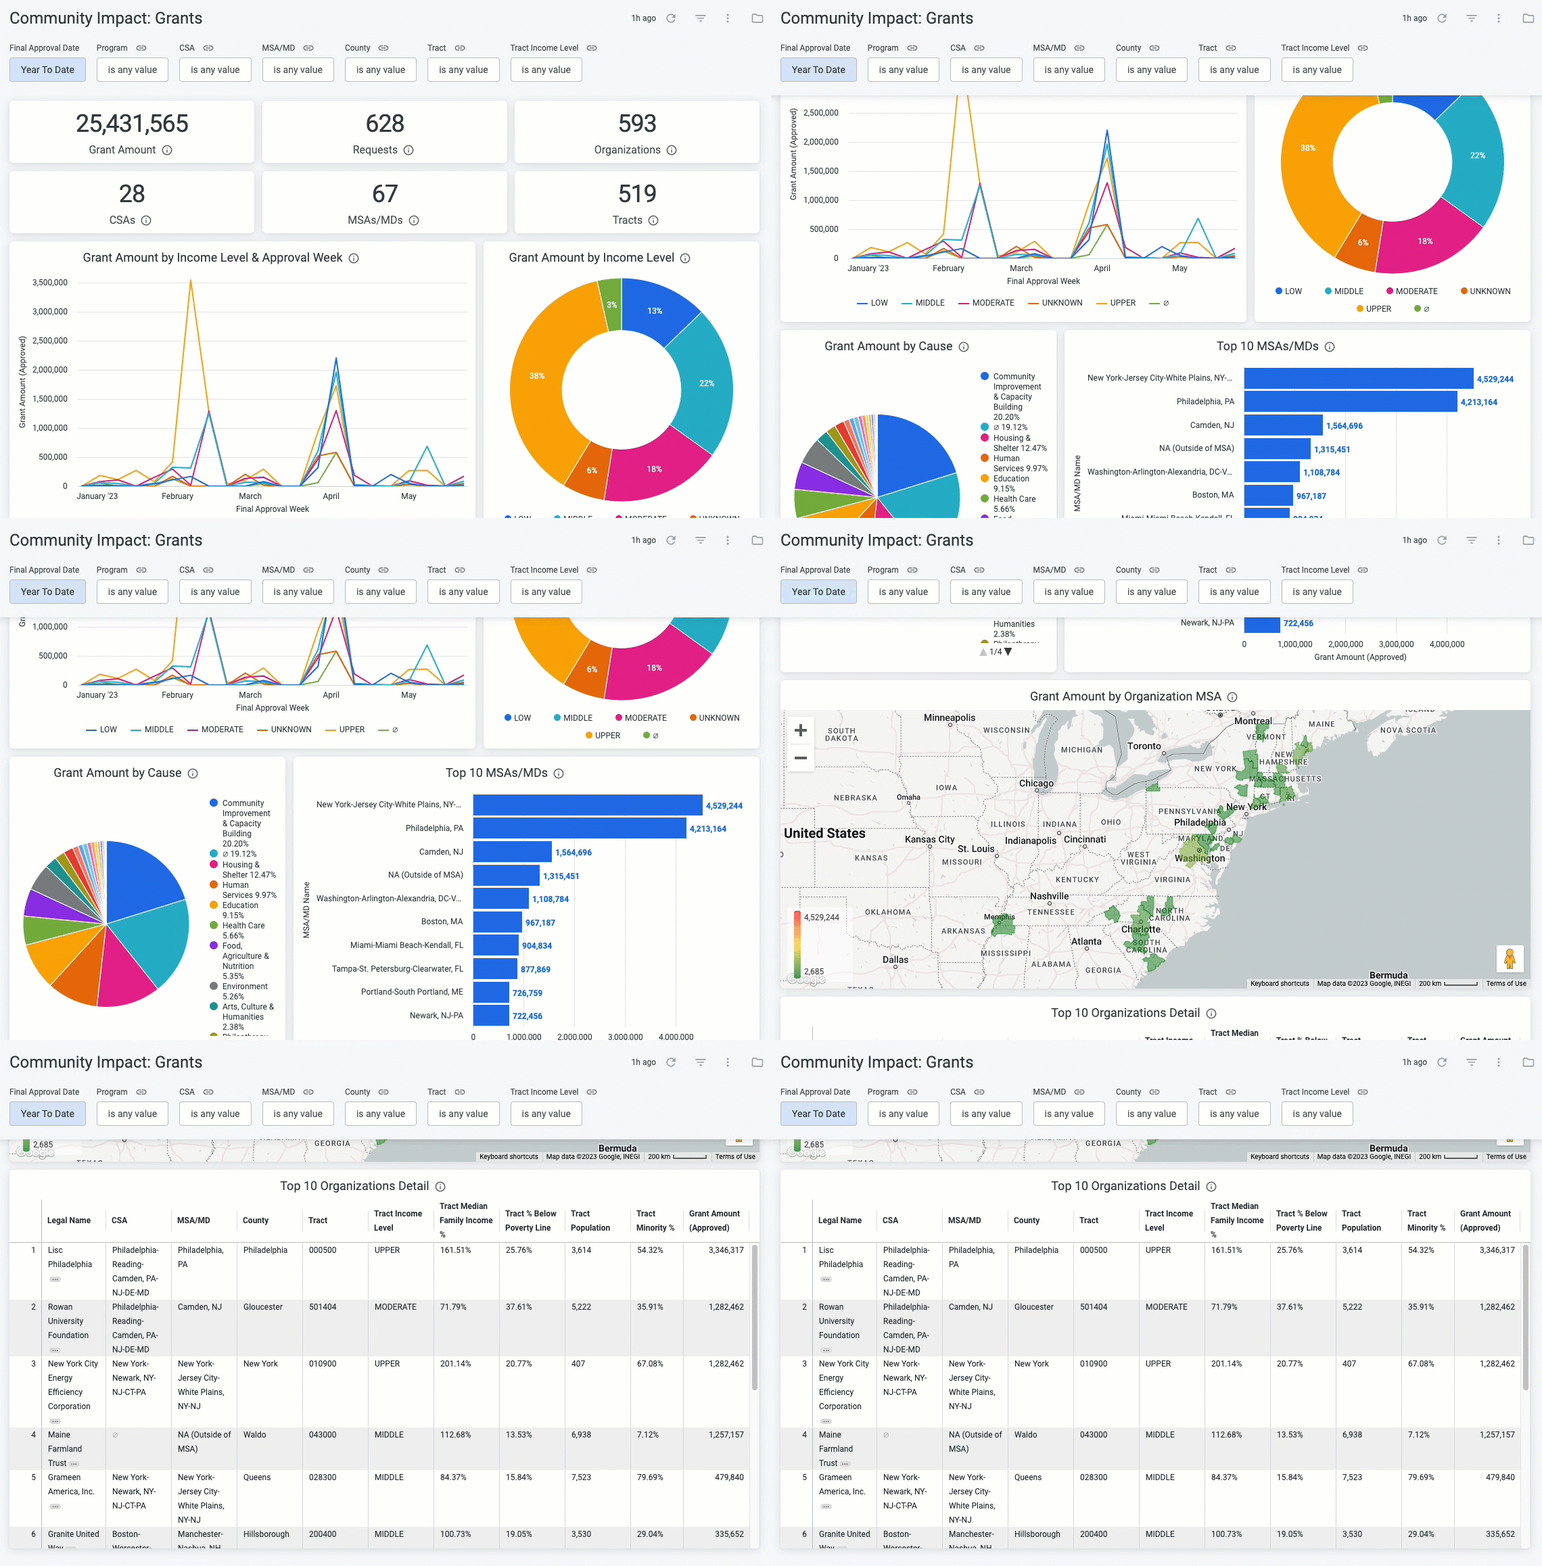
The following is a list of reports included in the Community Impact: Grants standard dashboard.
Report Name
|
Description
|
| Grant Amount | The sum of the approved grant amounts. |
| Requests | Unique count of approved requests. |
| Organizations | Unique count of organizations tied to approved grants. |
| CSAs | Unique count of organization CSAs (Combined Statistical Areas) for approved grants. |
| MSAs/MDs | Unique count of organization MSAs (Metropolitan Statistical Areas) or MDs (Metropolitan Divisions) tied to approved grants. |
| Tracts | Unique count of organization census tracts tied to approved grants. |
| Grant Amount by Income Level & Approval Week | Approved grant amount for each organization income level, broken down by approval week. |
| Grant Amount by Income Level | The percentage of the total approved grant amount broken down by the organization's income level. |
| Grant Amount by Cause | Total approved grant amount by organization cause. |
| Top 10 MSAs/MDs | The top 10 organization MSAs (Metropolitan Statistical Areas) or MDs (Metropolitan Divisions) tied to approved grants. |
| Grant Amount by Organization MSA | Total approved grant amount by organization MSA (Metropolitan Statistical Area). |
| Top 10 Organizations Detail | The top 10 organizations tied to approved grants, with additional geographical detail provided. Explore on this tile to see the full list of organizations tied to approved grants. |
Step 3: Use the Dashboard Filters
Insights users can utilize the following filters to adjust their view of the data displayed across all tiles within this dashboard.


