The Grant Approval Process dashboard provides an overview of common pipeline averages related to the grant approval process including metrics on Total Requests per Grant Status and Average # of Days it takes a request to move through various stages of the approval process.
The dashboard, also, reports on Request Count broken down by week including their average request amount, the average number of days the requests were open, all open requests, and who their next approver will be.
Target Audience: Program Administrators & Program Coordinators
Proceed as follows to further explore the Grant Approval Process standard dashboard and its features.
Step 1: Access the Dashboard
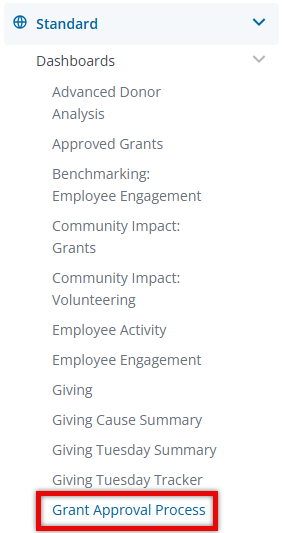
Navigate to the Insights platform and choose Grant Approval Process from the list of Standard Dashboards in the left-side navigation panel.
Step 2: Explore the Dashboard Reports
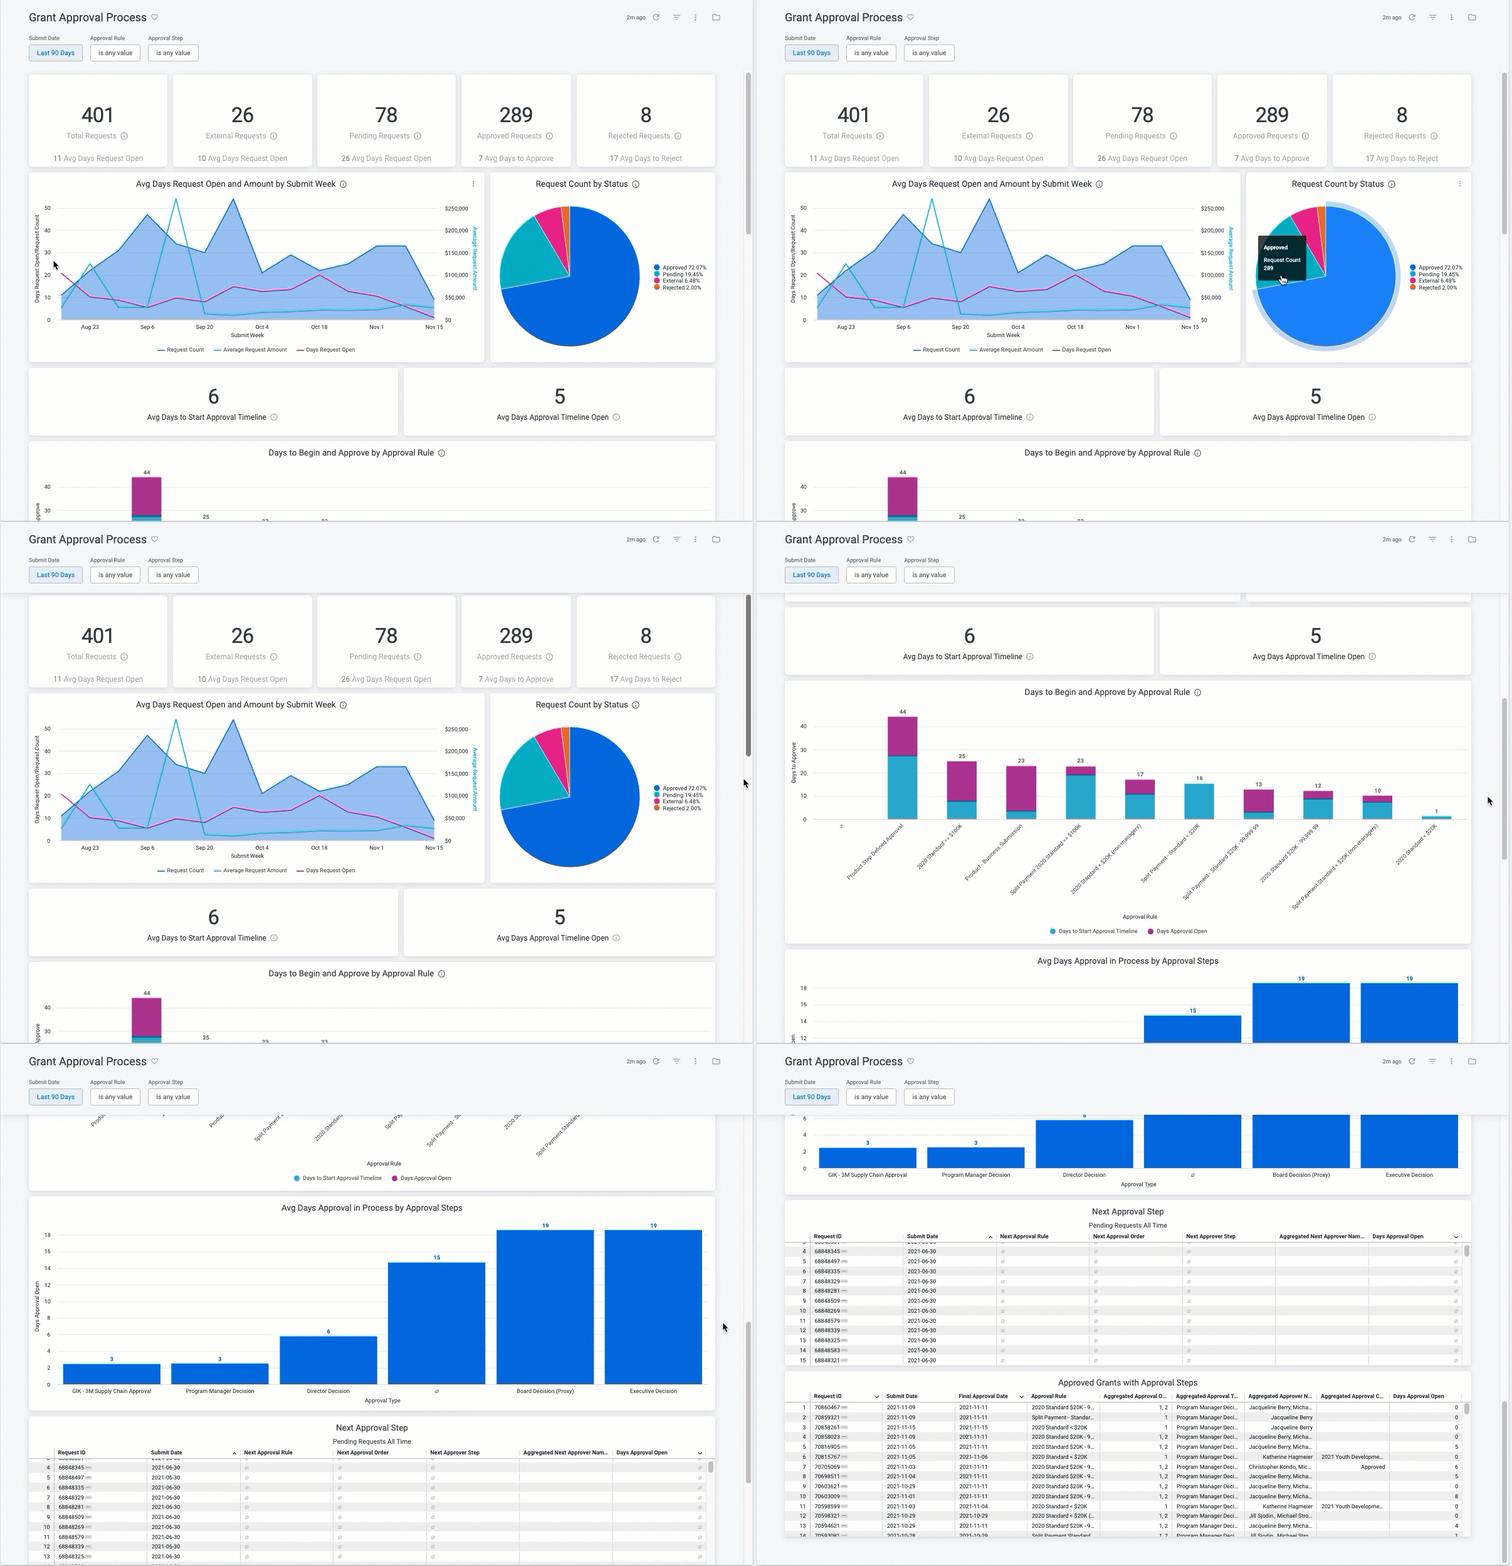
The following is a list of reports included in the Grant Approval Process standard dashboard.
Report Name
|
Description
|
| Total Requests | Count of unique requests in any disposition. |
| External Requests | Count of unique requests with a disposition of external. |
| Pending Requests | Count of unique requests with a disposition of pending. |
| Approved Requests | Count of unique requests with a disposition of approved. |
| Rejected Requests | Count of unique requests with a disposition of rejected. |
| Average Days Request Open and Amount | Number of requests submitted in a given week, the average requested amount, and the average number of days the requests were open from the submit date through the final approval date (or today's date if still open). |
| Request Count by Status | Count of unique requests by disposition. |
| Avg Days to Start Approval Timeline | Average number of days between the submit date and the approval submit date. Numbers are rounded to the nearest whole number. |
| Avg Days Approval Timeline Open | Average number of days between the approval submit date and the final approval date or today's date. Numbers are rounded to the nearest whole number. |
| Days to Begin and Approve by Approval Rule | Average number of days between the submit date and the final approval date or today's date. Broken out by the Days to Start the Approval and Days Approval is Open. |
| Avg Days Approval in Process by Approval Steps | Average number of Days it takes a request to move through various stages of the approval process. |
| Next Approval Step | Approval step for requests in pending status. |
| Approved Grants with Approval Steps | Approved Grant requests with approval steps. |
Step 3: Use the Dashboard Filters
Insights users can utilize the following filters to adjust their view of the data displayed across all tiles within this dashboard.


