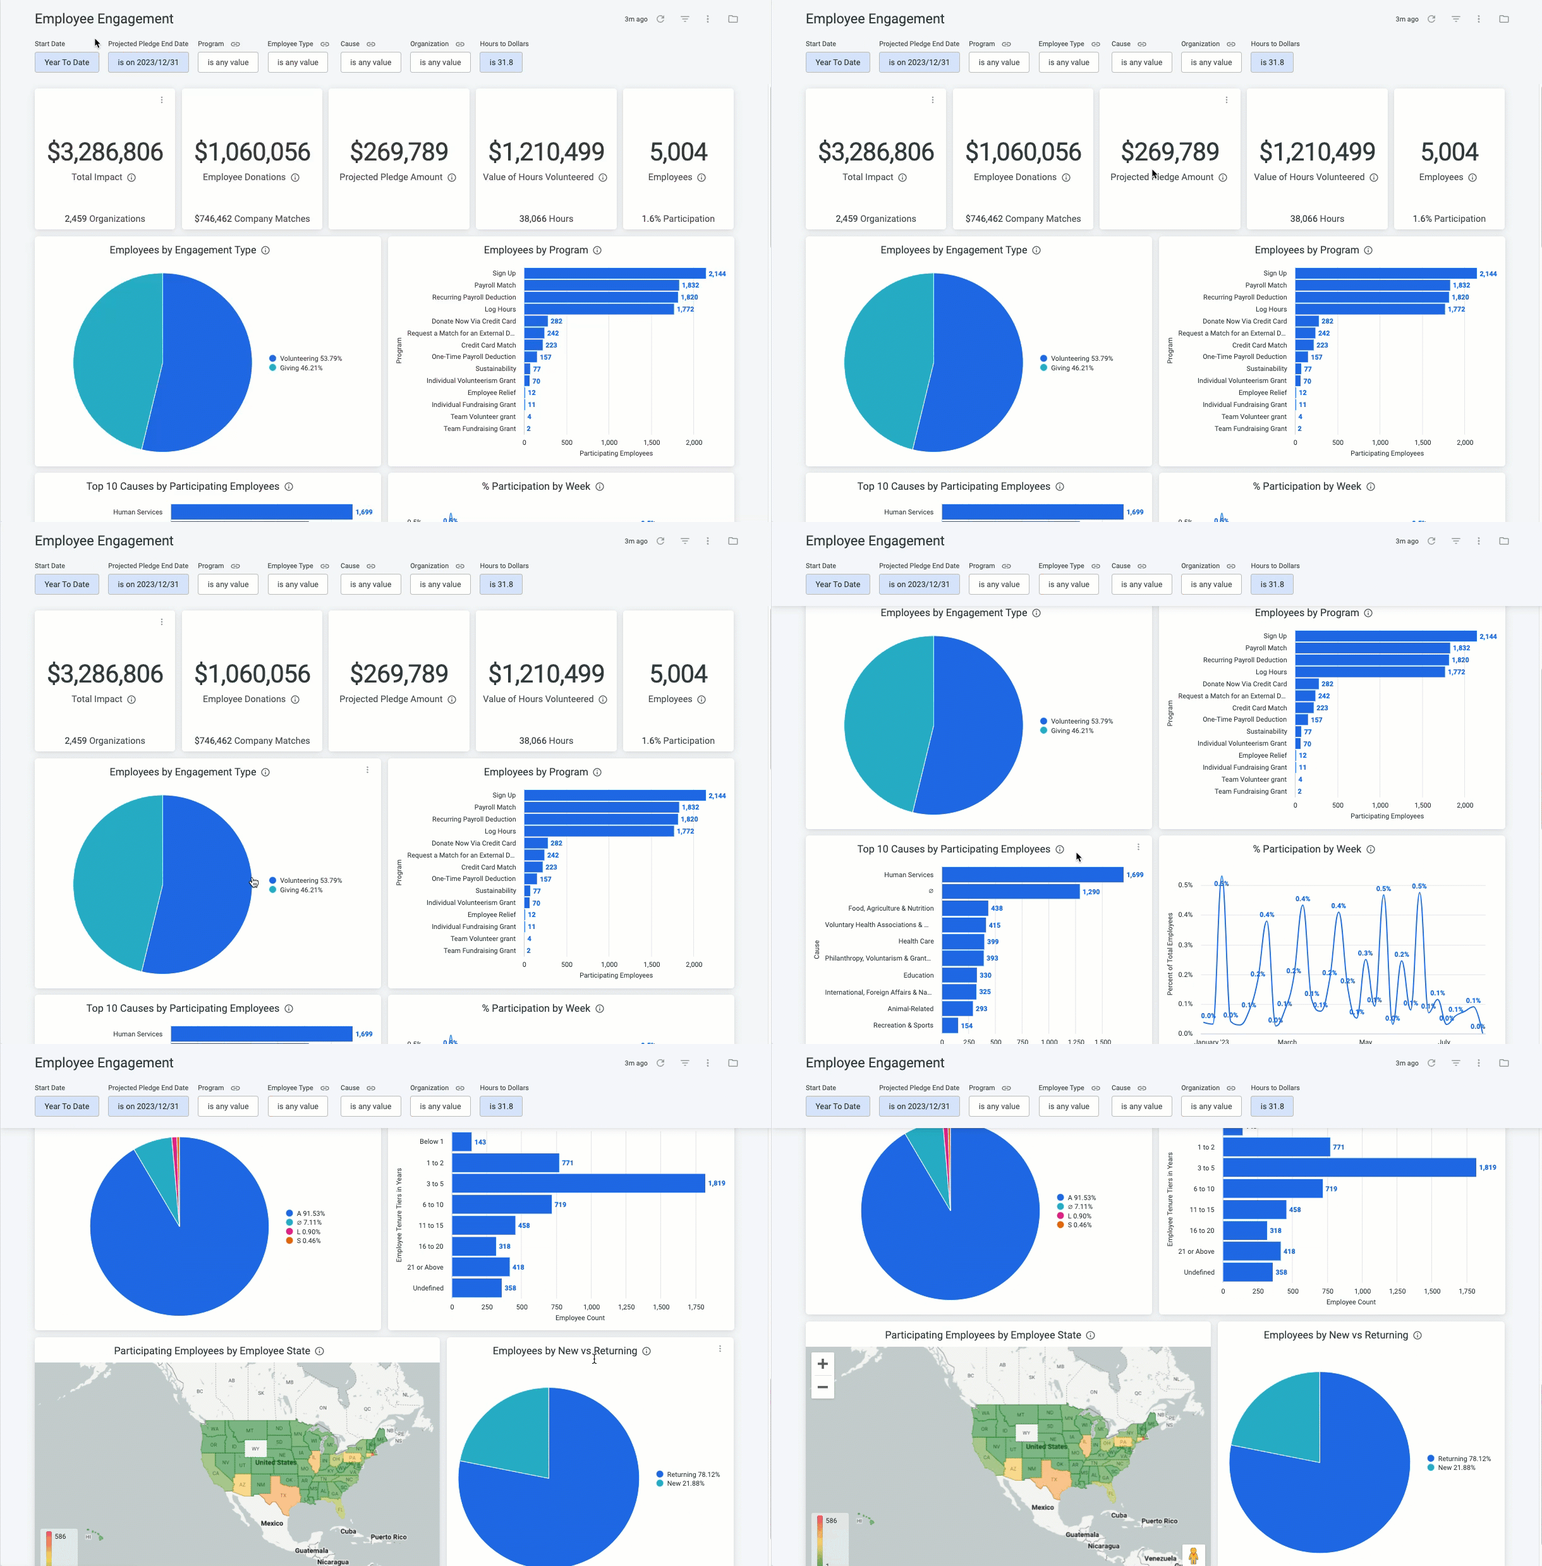
The Employee Engagement standard dashboard provides a holistic view into the analysis of employee engagement across both Giving & Volunteering, providing a deeper look into the type of employees who are engaging, when they are engaging, and with which programs & causes they are most engaged.
- This dashboard includes visualizations for Total Impact (inclusive of employee donations, existing and projected employee pledges, company matches, and the value of employee hours volunteered), % Participation By Week, Employees by Engagement Type (Giving vs Volunteerg), Employee Type, Employee Tenure & Employee State, Top 10 Employee Causes, and New vs Returning Employee Count.
Target Audience: Program Administrators & Program Coordinators
Proceed as follows to further explore the Employee Engagement standard dashboard and its features.
Step 1: Access the Dashboard
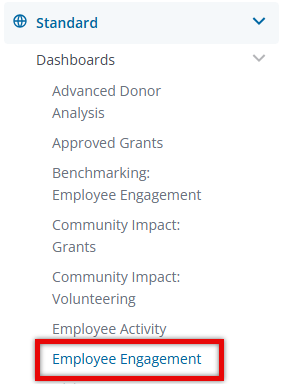
Navigate to the Insights platform and choose Employee Engagement from the list of Standard Dashboards in the left-side navigation panel.
Step 2: Explore the Dashboard Reports
The following is a list of reports included in the Employee Engagement standard dashboard.
Report Name
|
Description
|
| Total Impact | Sum of all donations, projected pledge amount, matches, and value of hours volunteered. Organizations - Unique count of Non-Profits with which employees engaged. These do not include any records in disposition Canceled or Rejected. |
| Employee Donations | Sum of employee cash gift amounts. Company Matches - Sum of company match amounts. These do not include any records in disposition Canceled or Rejected. |
| Projected Pledge Amount | Bonterra’s projected deduction amount remaining, based on deduction/gift summary dates, statuses, and the projected pledge end date selected in the corresponding dashboard filter. |
| Value of Hours Volunteered | The dollar value of the total hours volunteered multiplied by the count of total hours. This default value is based on Independent Sector's "Value of Volunteer Time" (https://independentsector.org/resource/value-of-volunteer-time/). To adjust this value, utilize the "Hours to Dollars" filter. Hours - Sum of hours volunteered. These do not include any records in disposition Canceled or Rejected. |
| Employees - Unique employee count (both active/inactive) % Participation | Unique Employees (both active/inactive) / Total Current Active Employee Population These do not include any records in disposition Canceled or Rejected. |
| Employees by Engagement Type | Unique count of employees engaged in Giving vs Volunteering. This does not include any records in disposition Canceled or Rejected. |
| Employees by Program | Unique count of employees by Program (Proposal Type). This does not include any records in disposition Canceled or Rejected. |
| Top 10 Causes by Participating Employees | Top 10 Causes based on unique employee count. This does not include any records in disposition Canceled or Rejected. |
| % Participation by Week | Percentage of total employee participation over a period of time by Create Week. If the Create Week began prior to the date range selected, the returned data will still only include the filtered dates. This does not include any records in disposition Canceled or Rejected. |
| Employees by Employee Type | Unique count of employees by Employee Type. This does not include any records in disposition Canceled or Rejected. |
| Employees by Tenure | Unique count of employees by tenure in years. This does not include any records in disposition Canceled or Rejected. |
| Participating Employees by Employee State | Unique count of employees by Donor State. This does not include any records in disposition Canceled or Rejected. |
| Employees by New vs Returning | Unique count of New vs Returning employees. If the employee has never previously donated or volunteered, then they will be considered "New". If the employee has previously donated or volunteered at any point in time, then they will be considered "Returning". This does not include any records in disposition Canceled or Rejected. |
Step 3: Use the Dashboard Filters
Insights users can utilize the following filters to adjust their view of the data displayed across all tiles within this dashboard.
- Start Date
- Projected Pledge End Date
- Program
- Employee Type
- Cause
- Organization
- Hours to Dollars (calculation)
What else do you need help with?
Not what you're looking for? Navigate to Insights Standard Dashboards Overview


